Immigrants from Peru vs Brazilian Householder Income Ages 45 - 64 years
COMPARE
Immigrants from Peru
Brazilian
Householder Income Ages 45 - 64 years
Householder Income Ages 45 - 64 years Comparison
Immigrants from Peru
Brazilians
$103,173
HOUSEHOLDER INCOME AGES 45 - 64 YEARS
80.7/ 100
METRIC RATING
150th/ 347
METRIC RANK
$104,408
HOUSEHOLDER INCOME AGES 45 - 64 YEARS
88.6/ 100
METRIC RATING
135th/ 347
METRIC RANK
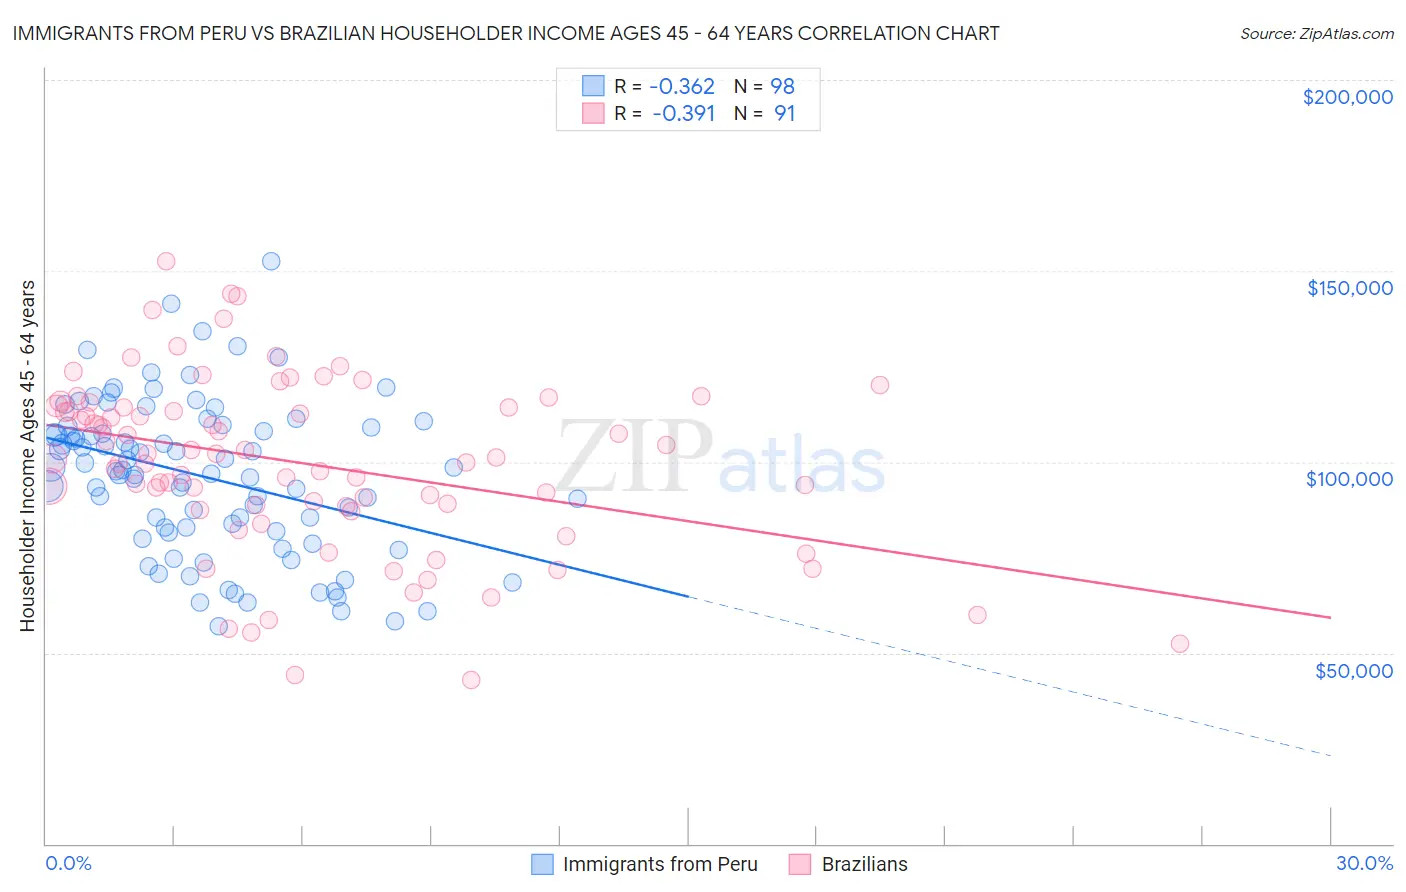
Immigrants from Peru vs Brazilian Householder Income Ages 45 - 64 years Correlation Chart
The statistical analysis conducted on geographies consisting of 328,568,384 people shows a mild negative correlation between the proportion of Immigrants from Peru and household income with householder between the ages 45 and 64 in the United States with a correlation coefficient (R) of -0.362 and weighted average of $103,173. Similarly, the statistical analysis conducted on geographies consisting of 323,438,021 people shows a mild negative correlation between the proportion of Brazilians and household income with householder between the ages 45 and 64 in the United States with a correlation coefficient (R) of -0.391 and weighted average of $104,408, a difference of 1.2%.
Householder Income Ages 45 - 64 years Correlation Summary
| Measurement | Immigrants from Peru | Brazilian |
| Minimum | $56,875 | $42,860 |
| Maximum | $152,612 | $152,670 |
| Range | $95,737 | $109,810 |
| Mean | $96,084 | $99,594 |
| Median | $97,801 | $101,250 |
| Interquartile 25% (IQ1) | $81,677 | $88,262 |
| Interquartile 75% (IQ3) | $109,063 | $114,328 |
| Interquartile Range (IQR) | $27,386 | $26,066 |
| Standard Deviation (Sample) | $20,026 | $22,722 |
| Standard Deviation (Population) | $19,924 | $22,597 |
Demographics Similar to Immigrants from Peru and Brazilians by Householder Income Ages 45 - 64 years
In terms of householder income ages 45 - 64 years, the demographic groups most similar to Immigrants from Peru are Immigrants from Sierra Leone ($103,227, a difference of 0.050%), Swiss ($103,071, a difference of 0.10%), Irish ($103,067, a difference of 0.10%), Immigrants from Germany ($103,282, a difference of 0.11%), and Basque ($103,387, a difference of 0.21%). Similarly, the demographic groups most similar to Brazilians are Arab ($104,566, a difference of 0.15%), Canadian ($104,560, a difference of 0.15%), Taiwanese ($104,180, a difference of 0.22%), Lebanese ($104,734, a difference of 0.31%), and Hungarian ($103,913, a difference of 0.48%).
| Demographics | Rating | Rank | Householder Income Ages 45 - 64 years |
| Lebanese | 90.1 /100 | #132 | Exceptional $104,734 |
| Arabs | 89.3 /100 | #133 | Excellent $104,566 |
| Canadians | 89.3 /100 | #134 | Excellent $104,560 |
| Brazilians | 88.6 /100 | #135 | Excellent $104,408 |
| Taiwanese | 87.4 /100 | #136 | Excellent $104,180 |
| Hungarians | 85.8 /100 | #137 | Excellent $103,913 |
| Ethiopians | 84.7 /100 | #138 | Excellent $103,736 |
| Immigrants | Oceania | 84.5 /100 | #139 | Excellent $103,705 |
| Norwegians | 84.3 /100 | #140 | Excellent $103,682 |
| Immigrants | Uganda | 83.7 /100 | #141 | Excellent $103,584 |
| Luxembourgers | 83.3 /100 | #142 | Excellent $103,536 |
| Serbians | 83.2 /100 | #143 | Excellent $103,522 |
| Czechs | 83.1 /100 | #144 | Excellent $103,507 |
| Ugandans | 82.9 /100 | #145 | Excellent $103,472 |
| Immigrants | Chile | 82.5 /100 | #146 | Excellent $103,412 |
| Basques | 82.3 /100 | #147 | Excellent $103,387 |
| Immigrants | Germany | 81.5 /100 | #148 | Excellent $103,282 |
| Immigrants | Sierra Leone | 81.1 /100 | #149 | Excellent $103,227 |
| Immigrants | Peru | 80.7 /100 | #150 | Excellent $103,173 |
| Swiss | 79.9 /100 | #151 | Good $103,071 |
| Irish | 79.8 /100 | #152 | Good $103,067 |