Immigrants from Grenada vs Immigrants from Eastern Africa Householder Income Over 65 years
COMPARE
Immigrants from Grenada
Immigrants from Eastern Africa
Householder Income Over 65 years
Householder Income Over 65 years Comparison
Immigrants from Grenada
Immigrants from Eastern Africa
$50,747
HOUSEHOLDER INCOME OVER 65 YEARS
0.0/ 100
METRIC RATING
330th/ 347
METRIC RANK
$61,157
HOUSEHOLDER INCOME OVER 65 YEARS
55.0/ 100
METRIC RATING
166th/ 347
METRIC RANK
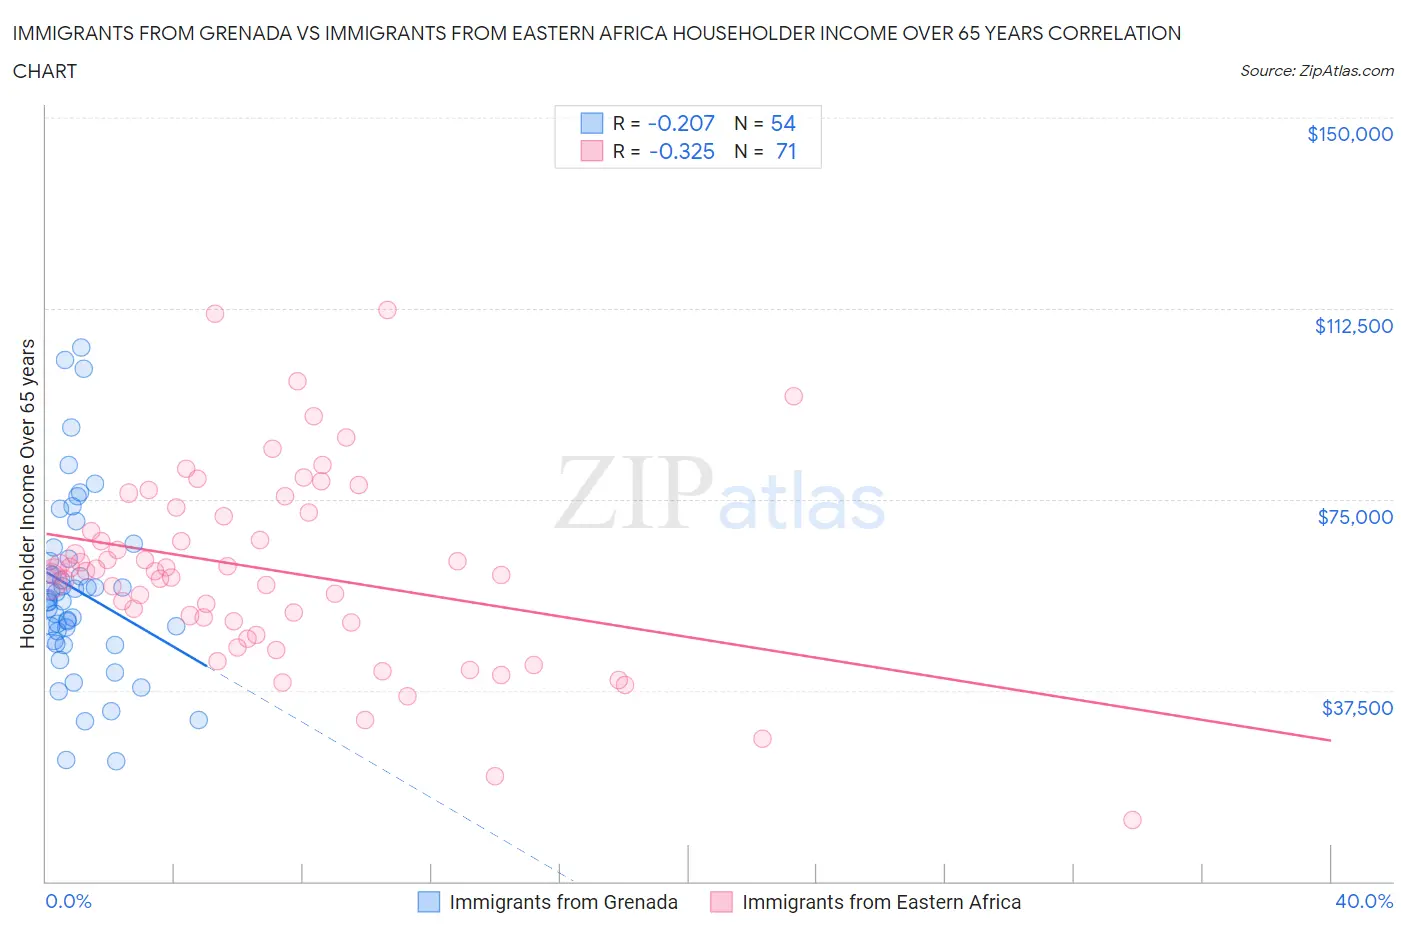
Immigrants from Grenada vs Immigrants from Eastern Africa Householder Income Over 65 years Correlation Chart
The statistical analysis conducted on geographies consisting of 67,113,016 people shows a weak negative correlation between the proportion of Immigrants from Grenada and household income with householder over the age of 65 in the United States with a correlation coefficient (R) of -0.207 and weighted average of $50,747. Similarly, the statistical analysis conducted on geographies consisting of 354,024,909 people shows a mild negative correlation between the proportion of Immigrants from Eastern Africa and household income with householder over the age of 65 in the United States with a correlation coefficient (R) of -0.325 and weighted average of $61,157, a difference of 20.5%.
Householder Income Over 65 years Correlation Summary
| Measurement | Immigrants from Grenada | Immigrants from Eastern Africa |
| Minimum | $23,659 | $12,049 |
| Maximum | $104,885 | $112,225 |
| Range | $81,226 | $100,176 |
| Mean | $57,145 | $61,052 |
| Median | $55,323 | $60,948 |
| Interquartile 25% (IQ1) | $47,246 | $50,731 |
| Interquartile 75% (IQ3) | $63,328 | $72,534 |
| Interquartile Range (IQR) | $16,082 | $21,803 |
| Standard Deviation (Sample) | $17,613 | $18,747 |
| Standard Deviation (Population) | $17,450 | $18,615 |
Similar Demographics by Householder Income Over 65 years
Demographics Similar to Immigrants from Grenada by Householder Income Over 65 years
In terms of householder income over 65 years, the demographic groups most similar to Immigrants from Grenada are Black/African American ($50,779, a difference of 0.060%), Hopi ($50,925, a difference of 0.35%), Pima ($50,539, a difference of 0.41%), Bahamian ($51,000, a difference of 0.50%), and Dutch West Indian ($50,475, a difference of 0.54%).
| Demographics | Rating | Rank | Householder Income Over 65 years |
| Cajuns | 0.0 /100 | #323 | Tragic $51,397 |
| Immigrants | Congo | 0.0 /100 | #324 | Tragic $51,393 |
| Immigrants | Haiti | 0.0 /100 | #325 | Tragic $51,219 |
| Kiowa | 0.0 /100 | #326 | Tragic $51,140 |
| Bahamians | 0.0 /100 | #327 | Tragic $51,000 |
| Hopi | 0.0 /100 | #328 | Tragic $50,925 |
| Blacks/African Americans | 0.0 /100 | #329 | Tragic $50,779 |
| Immigrants | Grenada | 0.0 /100 | #330 | Tragic $50,747 |
| Pima | 0.0 /100 | #331 | Tragic $50,539 |
| Dutch West Indians | 0.0 /100 | #332 | Tragic $50,475 |
| Cape Verdeans | 0.0 /100 | #333 | Tragic $50,077 |
| Immigrants | Dominica | 0.0 /100 | #334 | Tragic $50,071 |
| Crow | 0.0 /100 | #335 | Tragic $49,234 |
| Cubans | 0.0 /100 | #336 | Tragic $49,152 |
| Tohono O'odham | 0.0 /100 | #337 | Tragic $49,121 |
Demographics Similar to Immigrants from Eastern Africa by Householder Income Over 65 years
In terms of householder income over 65 years, the demographic groups most similar to Immigrants from Eastern Africa are Immigrants from Ukraine ($61,163, a difference of 0.010%), Ugandan ($61,177, a difference of 0.030%), Immigrants from North Macedonia ($61,175, a difference of 0.030%), Norwegian ($61,104, a difference of 0.090%), and Irish ($61,097, a difference of 0.10%).
| Demographics | Rating | Rank | Householder Income Over 65 years |
| Brazilians | 62.7 /100 | #159 | Good $61,465 |
| Portuguese | 62.1 /100 | #160 | Good $61,440 |
| Icelanders | 57.9 /100 | #161 | Average $61,270 |
| Czechs | 57.2 /100 | #162 | Average $61,244 |
| Ugandans | 55.5 /100 | #163 | Average $61,177 |
| Immigrants | North Macedonia | 55.4 /100 | #164 | Average $61,175 |
| Immigrants | Ukraine | 55.1 /100 | #165 | Average $61,163 |
| Immigrants | Eastern Africa | 55.0 /100 | #166 | Average $61,157 |
| Norwegians | 53.6 /100 | #167 | Average $61,104 |
| Irish | 53.4 /100 | #168 | Average $61,097 |
| Carpatho Rusyns | 53.3 /100 | #169 | Average $61,093 |
| Serbians | 53.1 /100 | #170 | Average $61,087 |
| Inupiat | 52.4 /100 | #171 | Average $61,061 |
| Immigrants | Poland | 51.9 /100 | #172 | Average $61,041 |
| Immigrants | Micronesia | 50.8 /100 | #173 | Average $61,000 |