Immigrants from Germany vs Syrian Householder Income Ages 25 - 44 years
COMPARE
Immigrants from Germany
Syrian
Householder Income Ages 25 - 44 years
Householder Income Ages 25 - 44 years Comparison
Immigrants from Germany
Syrians
$95,913
HOUSEHOLDER INCOME AGES 25 - 44 YEARS
67.9/ 100
METRIC RATING
156th/ 347
METRIC RANK
$99,215
HOUSEHOLDER INCOME AGES 25 - 44 YEARS
92.9/ 100
METRIC RATING
118th/ 347
METRIC RANK
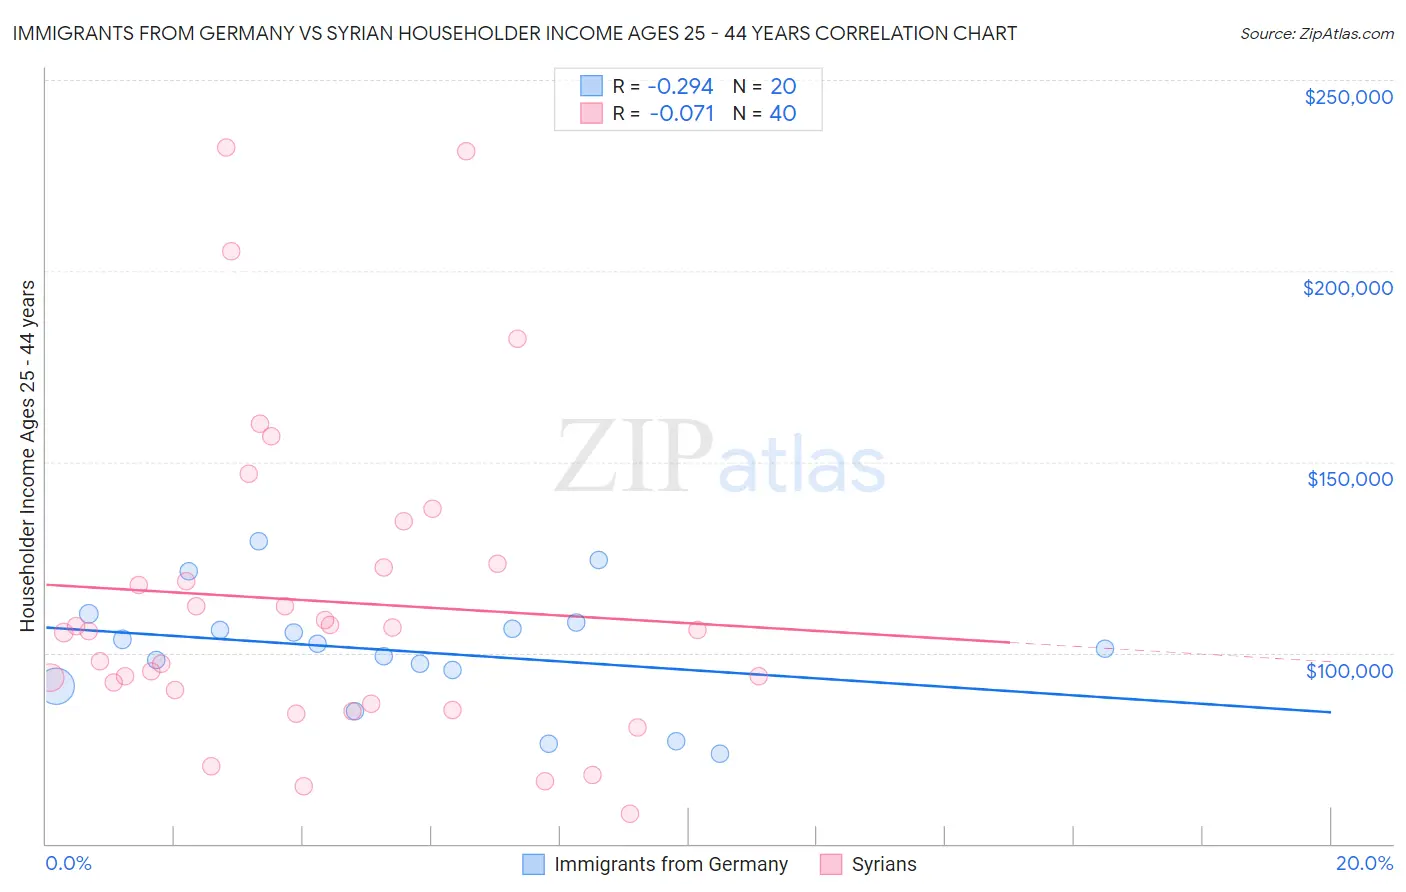
Immigrants from Germany vs Syrian Householder Income Ages 25 - 44 years Correlation Chart
The statistical analysis conducted on geographies consisting of 462,354,902 people shows a weak negative correlation between the proportion of Immigrants from Germany and household income with householder between the ages 25 and 44 in the United States with a correlation coefficient (R) of -0.294 and weighted average of $95,913. Similarly, the statistical analysis conducted on geographies consisting of 265,710,872 people shows a slight negative correlation between the proportion of Syrians and household income with householder between the ages 25 and 44 in the United States with a correlation coefficient (R) of -0.071 and weighted average of $99,215, a difference of 3.4%.
Householder Income Ages 25 - 44 years Correlation Summary
| Measurement | Immigrants from Germany | Syrian |
| Minimum | $73,472 | $57,774 |
| Maximum | $129,121 | $232,386 |
| Range | $55,649 | $174,612 |
| Mean | $100,474 | $113,575 |
| Median | $101,592 | $105,902 |
| Interquartile 25% (IQ1) | $93,342 | $88,495 |
| Interquartile 75% (IQ3) | $107,107 | $122,954 |
| Interquartile Range (IQR) | $13,765 | $34,460 |
| Standard Deviation (Sample) | $15,097 | $41,385 |
| Standard Deviation (Population) | $14,715 | $40,865 |
Similar Demographics by Householder Income Ages 25 - 44 years
Demographics Similar to Immigrants from Germany by Householder Income Ages 25 - 44 years
In terms of householder income ages 25 - 44 years, the demographic groups most similar to Immigrants from Germany are Moroccan ($96,117, a difference of 0.21%), Immigrants from Uganda ($95,698, a difference of 0.22%), Scandinavian ($95,596, a difference of 0.33%), Costa Rican ($95,565, a difference of 0.36%), and Icelander ($95,560, a difference of 0.37%).
| Demographics | Rating | Rank | Householder Income Ages 25 - 44 years |
| Basques | 76.6 /100 | #149 | Good $96,709 |
| Ugandans | 76.2 /100 | #150 | Good $96,667 |
| Czechs | 74.8 /100 | #151 | Good $96,525 |
| South American Indians | 74.5 /100 | #152 | Good $96,497 |
| Slovenes | 73.9 /100 | #153 | Good $96,439 |
| Slavs | 73.2 /100 | #154 | Good $96,377 |
| Moroccans | 70.3 /100 | #155 | Good $96,117 |
| Immigrants | Germany | 67.9 /100 | #156 | Good $95,913 |
| Immigrants | Uganda | 65.2 /100 | #157 | Good $95,698 |
| Scandinavians | 63.9 /100 | #158 | Good $95,596 |
| Costa Ricans | 63.5 /100 | #159 | Good $95,565 |
| Icelanders | 63.4 /100 | #160 | Good $95,560 |
| Immigrants | Portugal | 62.8 /100 | #161 | Good $95,512 |
| Swiss | 62.8 /100 | #162 | Good $95,511 |
| Immigrants | Saudi Arabia | 62.0 /100 | #163 | Good $95,450 |
Demographics Similar to Syrians by Householder Income Ages 25 - 44 years
In terms of householder income ages 25 - 44 years, the demographic groups most similar to Syrians are Immigrants from Northern Africa ($99,232, a difference of 0.020%), Jordanian ($99,186, a difference of 0.030%), Swedish ($99,136, a difference of 0.080%), Portuguese ($99,429, a difference of 0.22%), and Carpatho Rusyn ($99,449, a difference of 0.24%).
| Demographics | Rating | Rank | Householder Income Ages 25 - 44 years |
| Chileans | 95.1 /100 | #111 | Exceptional $99,900 |
| Poles | 94.5 /100 | #112 | Exceptional $99,685 |
| Tongans | 94.2 /100 | #113 | Exceptional $99,604 |
| Immigrants | Western Asia | 94.0 /100 | #114 | Exceptional $99,516 |
| Carpatho Rusyns | 93.7 /100 | #115 | Exceptional $99,449 |
| Portuguese | 93.7 /100 | #116 | Exceptional $99,429 |
| Immigrants | Northern Africa | 93.0 /100 | #117 | Exceptional $99,232 |
| Syrians | 92.9 /100 | #118 | Exceptional $99,215 |
| Jordanians | 92.8 /100 | #119 | Exceptional $99,186 |
| Swedes | 92.7 /100 | #120 | Exceptional $99,136 |
| Peruvians | 91.7 /100 | #121 | Exceptional $98,886 |
| Immigrants | Uzbekistan | 91.5 /100 | #122 | Exceptional $98,849 |
| Palestinians | 91.2 /100 | #123 | Exceptional $98,777 |
| Zimbabweans | 90.3 /100 | #124 | Exceptional $98,586 |
| Pakistanis | 89.3 /100 | #125 | Excellent $98,401 |