Immigrants from Germany vs Fijian Householder Income Ages 25 - 44 years
COMPARE
Immigrants from Germany
Fijian
Householder Income Ages 25 - 44 years
Householder Income Ages 25 - 44 years Comparison
Immigrants from Germany
Fijians
$95,913
HOUSEHOLDER INCOME AGES 25 - 44 YEARS
67.9/ 100
METRIC RATING
156th/ 347
METRIC RANK
$79,956
HOUSEHOLDER INCOME AGES 25 - 44 YEARS
0.0/ 100
METRIC RATING
310th/ 347
METRIC RANK
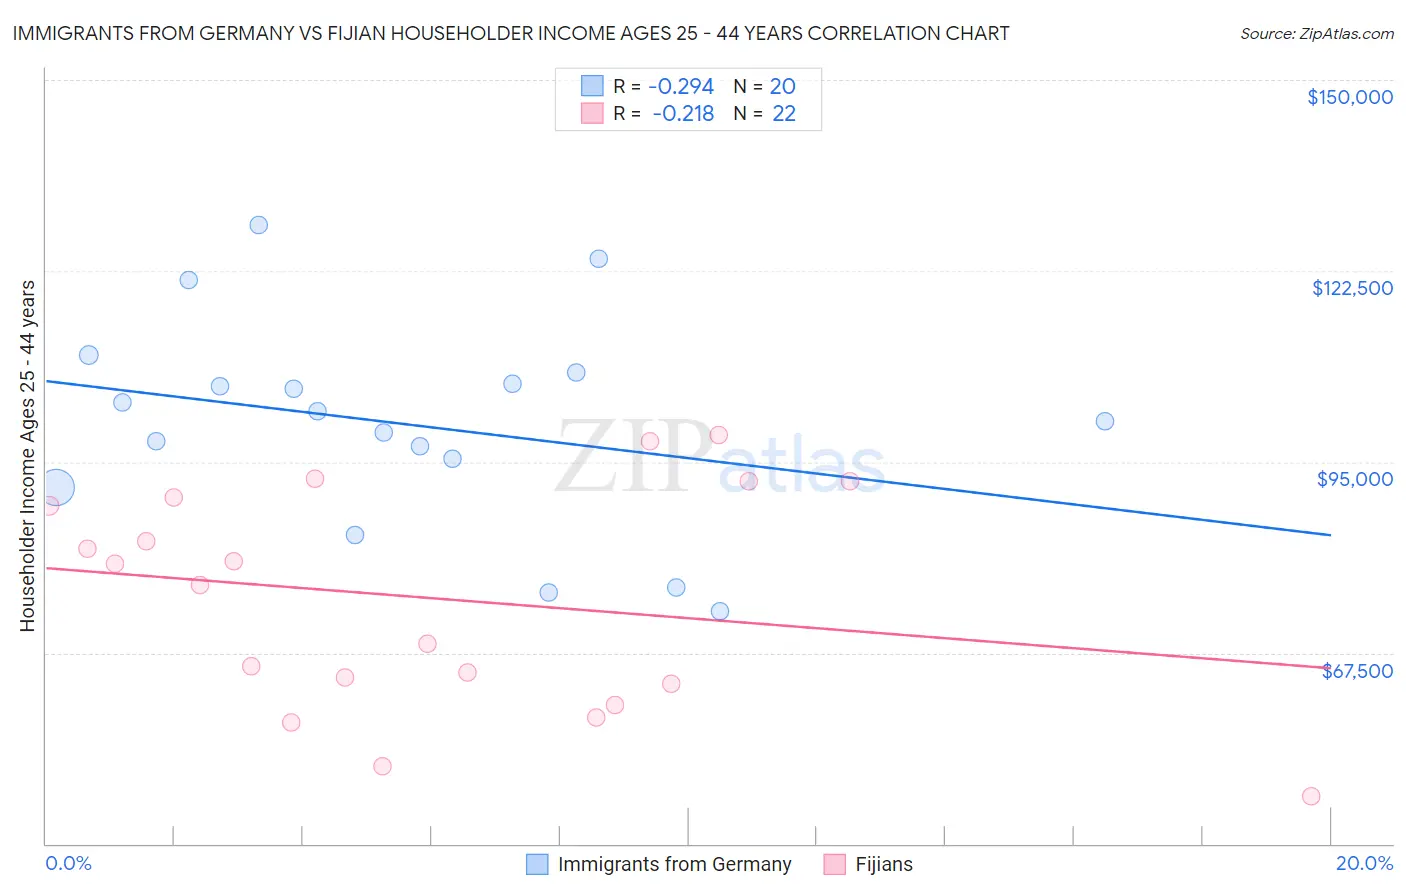
Immigrants from Germany vs Fijian Householder Income Ages 25 - 44 years Correlation Chart
The statistical analysis conducted on geographies consisting of 462,354,902 people shows a weak negative correlation between the proportion of Immigrants from Germany and household income with householder between the ages 25 and 44 in the United States with a correlation coefficient (R) of -0.294 and weighted average of $95,913. Similarly, the statistical analysis conducted on geographies consisting of 55,935,087 people shows a weak negative correlation between the proportion of Fijians and household income with householder between the ages 25 and 44 in the United States with a correlation coefficient (R) of -0.218 and weighted average of $79,956, a difference of 20.0%.
Householder Income Ages 25 - 44 years Correlation Summary
| Measurement | Immigrants from Germany | Fijian |
| Minimum | $73,472 | $46,875 |
| Maximum | $129,121 | $98,958 |
| Range | $55,649 | $52,083 |
| Mean | $100,474 | $75,303 |
| Median | $101,592 | $78,830 |
| Interquartile 25% (IQ1) | $93,342 | $63,125 |
| Interquartile 75% (IQ3) | $107,107 | $89,954 |
| Interquartile Range (IQR) | $13,765 | $26,829 |
| Standard Deviation (Sample) | $15,097 | $15,837 |
| Standard Deviation (Population) | $14,715 | $15,473 |
Similar Demographics by Householder Income Ages 25 - 44 years
Demographics Similar to Immigrants from Germany by Householder Income Ages 25 - 44 years
In terms of householder income ages 25 - 44 years, the demographic groups most similar to Immigrants from Germany are Moroccan ($96,117, a difference of 0.21%), Immigrants from Uganda ($95,698, a difference of 0.22%), Scandinavian ($95,596, a difference of 0.33%), Costa Rican ($95,565, a difference of 0.36%), and Icelander ($95,560, a difference of 0.37%).
| Demographics | Rating | Rank | Householder Income Ages 25 - 44 years |
| Basques | 76.6 /100 | #149 | Good $96,709 |
| Ugandans | 76.2 /100 | #150 | Good $96,667 |
| Czechs | 74.8 /100 | #151 | Good $96,525 |
| South American Indians | 74.5 /100 | #152 | Good $96,497 |
| Slovenes | 73.9 /100 | #153 | Good $96,439 |
| Slavs | 73.2 /100 | #154 | Good $96,377 |
| Moroccans | 70.3 /100 | #155 | Good $96,117 |
| Immigrants | Germany | 67.9 /100 | #156 | Good $95,913 |
| Immigrants | Uganda | 65.2 /100 | #157 | Good $95,698 |
| Scandinavians | 63.9 /100 | #158 | Good $95,596 |
| Costa Ricans | 63.5 /100 | #159 | Good $95,565 |
| Icelanders | 63.4 /100 | #160 | Good $95,560 |
| Immigrants | Portugal | 62.8 /100 | #161 | Good $95,512 |
| Swiss | 62.8 /100 | #162 | Good $95,511 |
| Immigrants | Saudi Arabia | 62.0 /100 | #163 | Good $95,450 |
Demographics Similar to Fijians by Householder Income Ages 25 - 44 years
In terms of householder income ages 25 - 44 years, the demographic groups most similar to Fijians are Chippewa ($80,005, a difference of 0.060%), Immigrants from Central America ($80,012, a difference of 0.070%), Haitian ($80,055, a difference of 0.12%), Apache ($80,260, a difference of 0.38%), and Immigrants from Dominican Republic ($80,319, a difference of 0.45%).
| Demographics | Rating | Rank | Householder Income Ages 25 - 44 years |
| Mexicans | 0.0 /100 | #303 | Tragic $80,427 |
| Immigrants | Caribbean | 0.0 /100 | #304 | Tragic $80,326 |
| Immigrants | Dominican Republic | 0.0 /100 | #305 | Tragic $80,319 |
| Apache | 0.0 /100 | #306 | Tragic $80,260 |
| Haitians | 0.0 /100 | #307 | Tragic $80,055 |
| Immigrants | Central America | 0.0 /100 | #308 | Tragic $80,012 |
| Chippewa | 0.0 /100 | #309 | Tragic $80,005 |
| Fijians | 0.0 /100 | #310 | Tragic $79,956 |
| Indonesians | 0.0 /100 | #311 | Tragic $79,543 |
| Immigrants | Haiti | 0.0 /100 | #312 | Tragic $79,391 |
| Menominee | 0.0 /100 | #313 | Tragic $79,358 |
| Cheyenne | 0.0 /100 | #314 | Tragic $79,152 |
| Ottawa | 0.0 /100 | #315 | Tragic $79,012 |
| Africans | 0.0 /100 | #316 | Tragic $78,986 |
| U.S. Virgin Islanders | 0.0 /100 | #317 | Tragic $78,911 |