Immigrants from Fiji vs Sudanese Per Capita Income
COMPARE
Immigrants from Fiji
Sudanese
Per Capita Income
Per Capita Income Comparison
Immigrants from Fiji
Sudanese
$42,694
PER CAPITA INCOME
25.2/ 100
METRIC RATING
194th/ 347
METRIC RANK
$41,695
PER CAPITA INCOME
9.9/ 100
METRIC RATING
215th/ 347
METRIC RANK
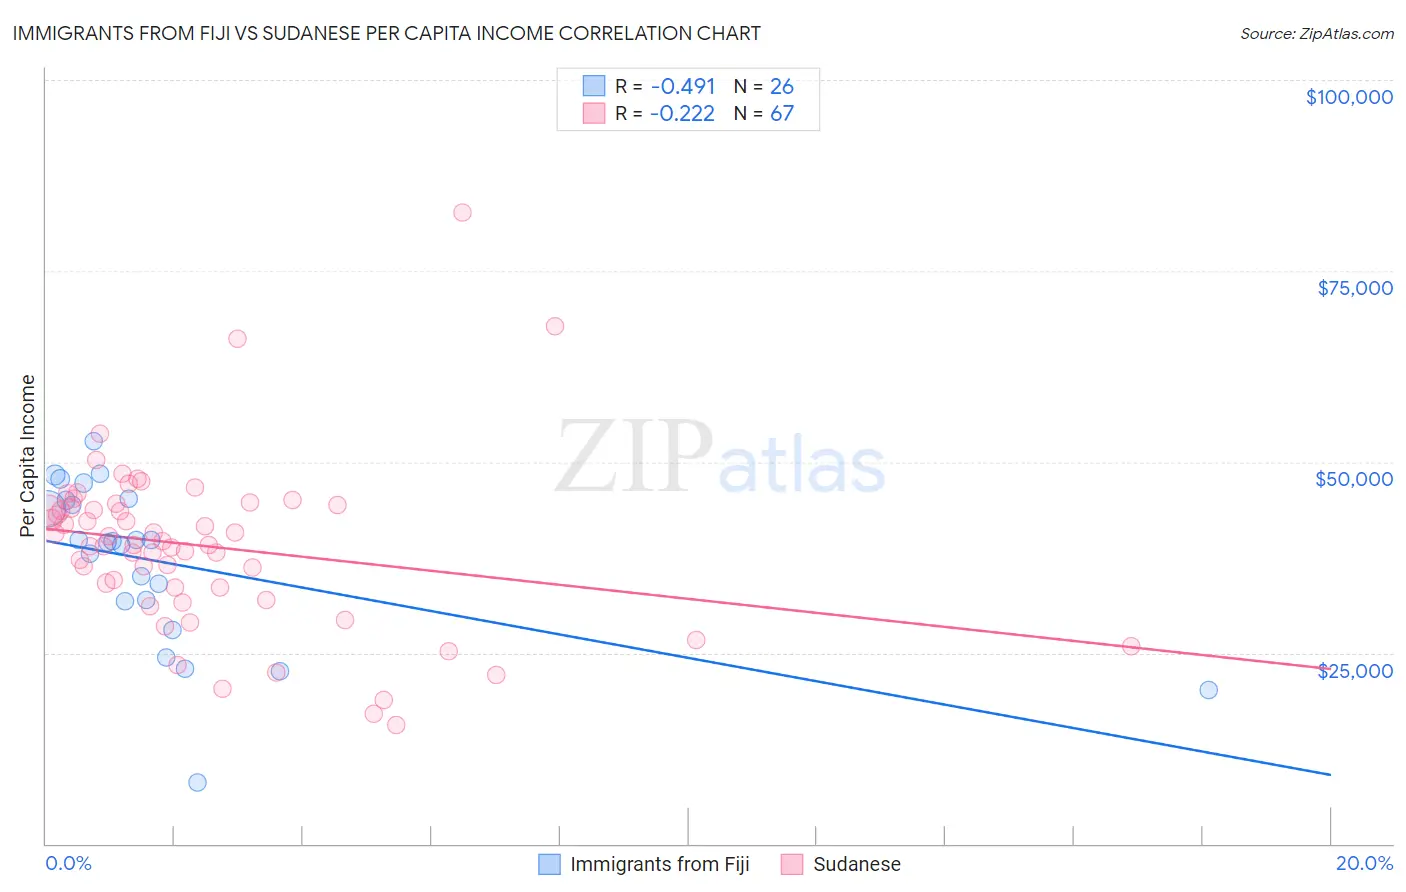
Immigrants from Fiji vs Sudanese Per Capita Income Correlation Chart
The statistical analysis conducted on geographies consisting of 93,756,204 people shows a moderate negative correlation between the proportion of Immigrants from Fiji and per capita income in the United States with a correlation coefficient (R) of -0.491 and weighted average of $42,694. Similarly, the statistical analysis conducted on geographies consisting of 110,152,165 people shows a weak negative correlation between the proportion of Sudanese and per capita income in the United States with a correlation coefficient (R) of -0.222 and weighted average of $41,695, a difference of 2.4%.
Per Capita Income Correlation Summary
| Measurement | Immigrants from Fiji | Sudanese |
| Minimum | $8,026 | $15,628 |
| Maximum | $52,700 | $82,685 |
| Range | $44,674 | $67,057 |
| Mean | $36,824 | $38,981 |
| Median | $39,532 | $39,137 |
| Interquartile 25% (IQ1) | $31,785 | $33,494 |
| Interquartile 75% (IQ3) | $44,942 | $44,276 |
| Interquartile Range (IQR) | $13,157 | $10,782 |
| Standard Deviation (Sample) | $10,646 | $11,237 |
| Standard Deviation (Population) | $10,440 | $11,153 |
Similar Demographics by Per Capita Income
Demographics Similar to Immigrants from Fiji by Per Capita Income
In terms of per capita income, the demographic groups most similar to Immigrants from Fiji are Immigrants from Kenya ($42,661, a difference of 0.080%), Immigrants from Sierra Leone ($42,752, a difference of 0.13%), Iraqi ($42,760, a difference of 0.16%), Dutch ($42,605, a difference of 0.21%), and Yugoslavian ($42,792, a difference of 0.23%).
| Demographics | Rating | Rank | Per Capita Income |
| Immigrants | Colombia | 31.5 /100 | #187 | Fair $42,971 |
| Immigrants | Africa | 31.0 /100 | #188 | Fair $42,950 |
| Bermudans | 30.1 /100 | #189 | Fair $42,911 |
| Kenyans | 27.7 /100 | #190 | Fair $42,808 |
| Yugoslavians | 27.4 /100 | #191 | Fair $42,792 |
| Iraqis | 26.7 /100 | #192 | Fair $42,760 |
| Immigrants | Sierra Leone | 26.5 /100 | #193 | Fair $42,752 |
| Immigrants | Fiji | 25.2 /100 | #194 | Fair $42,694 |
| Immigrants | Kenya | 24.5 /100 | #195 | Fair $42,661 |
| Dutch | 23.4 /100 | #196 | Fair $42,605 |
| Scotch-Irish | 22.6 /100 | #197 | Fair $42,563 |
| Immigrants | Portugal | 19.7 /100 | #198 | Poor $42,412 |
| Barbadians | 19.6 /100 | #199 | Poor $42,406 |
| Vietnamese | 19.0 /100 | #200 | Poor $42,368 |
| Immigrants | Thailand | 17.6 /100 | #201 | Poor $42,289 |
Demographics Similar to Sudanese by Per Capita Income
In terms of per capita income, the demographic groups most similar to Sudanese are Tongan ($41,693, a difference of 0.010%), Immigrants from Bangladesh ($41,709, a difference of 0.030%), Guamanian/Chamorro ($41,678, a difference of 0.040%), Immigrants from Venezuela ($41,727, a difference of 0.080%), and Trinidadian and Tobagonian ($41,655, a difference of 0.10%).
| Demographics | Rating | Rank | Per Capita Income |
| Panamanians | 13.9 /100 | #208 | Poor $42,035 |
| Immigrants | Sudan | 13.2 /100 | #209 | Poor $41,986 |
| Ecuadorians | 12.9 /100 | #210 | Poor $41,958 |
| Immigrants | Panama | 11.6 /100 | #211 | Poor $41,853 |
| Immigrants | Senegal | 11.3 /100 | #212 | Poor $41,830 |
| Immigrants | Venezuela | 10.2 /100 | #213 | Poor $41,727 |
| Immigrants | Bangladesh | 10.1 /100 | #214 | Poor $41,709 |
| Sudanese | 9.9 /100 | #215 | Tragic $41,695 |
| Tongans | 9.9 /100 | #216 | Tragic $41,693 |
| Guamanians/Chamorros | 9.7 /100 | #217 | Tragic $41,678 |
| Trinidadians and Tobagonians | 9.5 /100 | #218 | Tragic $41,655 |
| Puget Sound Salish | 8.1 /100 | #219 | Tragic $41,495 |
| Immigrants | Barbados | 7.9 /100 | #220 | Tragic $41,478 |
| Immigrants | Trinidad and Tobago | 7.9 /100 | #221 | Tragic $41,476 |
| Immigrants | Iraq | 7.1 /100 | #222 | Tragic $41,365 |