Immigrants from Morocco vs Sudanese Per Capita Income
COMPARE
Immigrants from Morocco
Sudanese
Per Capita Income
Per Capita Income Comparison
Immigrants from Morocco
Sudanese
$46,430
PER CAPITA INCOME
95.7/ 100
METRIC RATING
112th/ 347
METRIC RANK
$41,695
PER CAPITA INCOME
9.9/ 100
METRIC RATING
215th/ 347
METRIC RANK
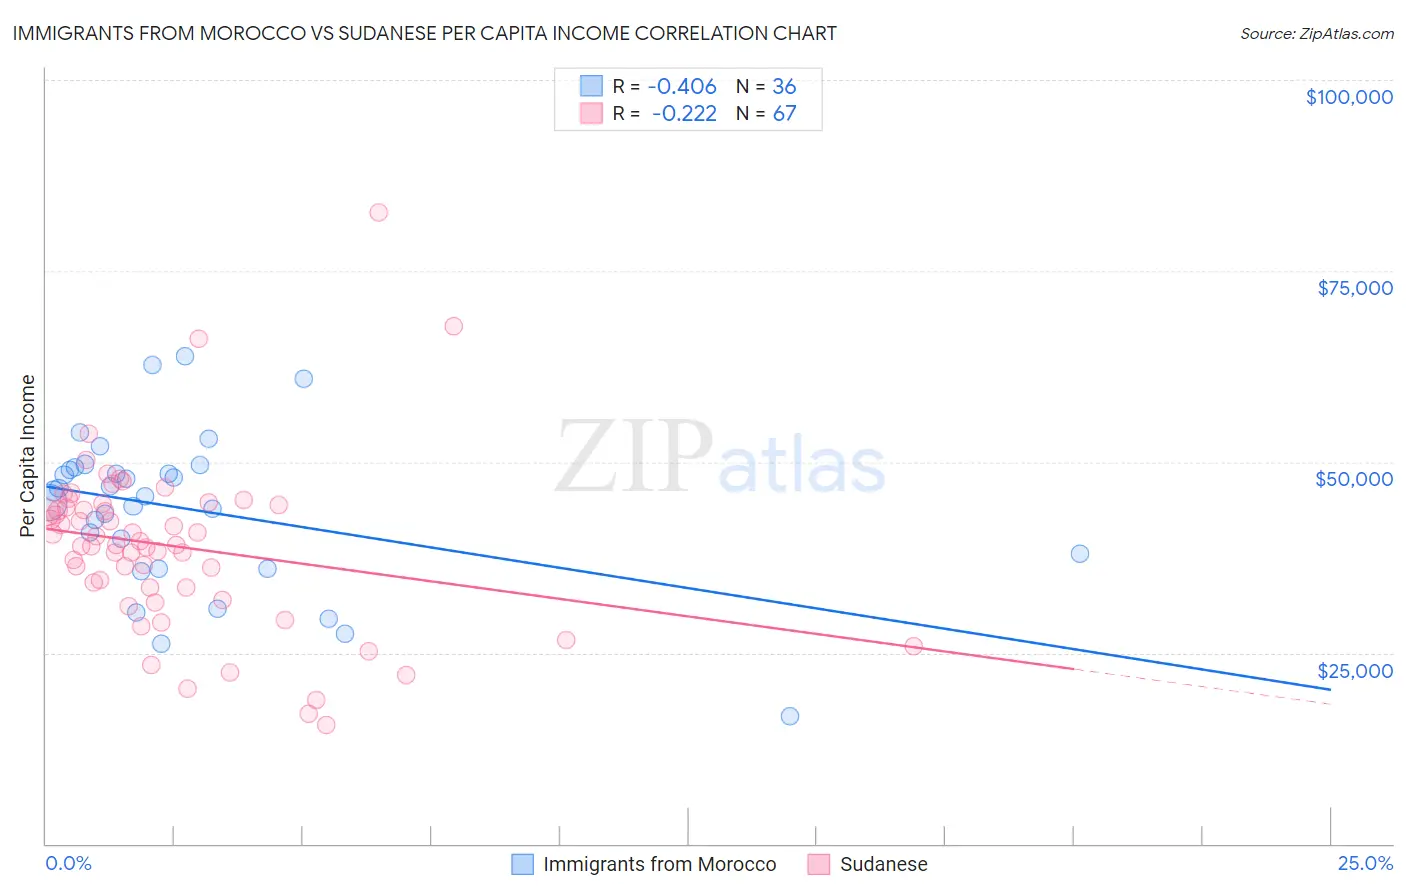
Immigrants from Morocco vs Sudanese Per Capita Income Correlation Chart
The statistical analysis conducted on geographies consisting of 178,911,890 people shows a moderate negative correlation between the proportion of Immigrants from Morocco and per capita income in the United States with a correlation coefficient (R) of -0.406 and weighted average of $46,430. Similarly, the statistical analysis conducted on geographies consisting of 110,152,165 people shows a weak negative correlation between the proportion of Sudanese and per capita income in the United States with a correlation coefficient (R) of -0.222 and weighted average of $41,695, a difference of 11.4%.
Per Capita Income Correlation Summary
| Measurement | Immigrants from Morocco | Sudanese |
| Minimum | $16,654 | $15,628 |
| Maximum | $63,792 | $82,685 |
| Range | $47,138 | $67,057 |
| Mean | $43,757 | $38,981 |
| Median | $45,863 | $39,137 |
| Interquartile 25% (IQ1) | $36,958 | $33,494 |
| Interquartile 75% (IQ3) | $49,075 | $44,276 |
| Interquartile Range (IQR) | $12,117 | $10,782 |
| Standard Deviation (Sample) | $10,240 | $11,237 |
| Standard Deviation (Population) | $10,097 | $11,153 |
Similar Demographics by Per Capita Income
Demographics Similar to Immigrants from Morocco by Per Capita Income
In terms of per capita income, the demographic groups most similar to Immigrants from Morocco are Taiwanese ($46,455, a difference of 0.050%), Chilean ($46,459, a difference of 0.060%), Immigrants from Albania ($46,387, a difference of 0.090%), Immigrants from Northern Africa ($46,531, a difference of 0.22%), and Immigrants from Kuwait ($46,543, a difference of 0.24%).
| Demographics | Rating | Rank | Per Capita Income |
| British | 96.3 /100 | #105 | Exceptional $46,571 |
| Ethiopians | 96.3 /100 | #106 | Exceptional $46,569 |
| Serbians | 96.2 /100 | #107 | Exceptional $46,551 |
| Immigrants | Kuwait | 96.2 /100 | #108 | Exceptional $46,543 |
| Immigrants | Northern Africa | 96.2 /100 | #109 | Exceptional $46,531 |
| Chileans | 95.9 /100 | #110 | Exceptional $46,459 |
| Taiwanese | 95.8 /100 | #111 | Exceptional $46,455 |
| Immigrants | Morocco | 95.7 /100 | #112 | Exceptional $46,430 |
| Immigrants | Albania | 95.5 /100 | #113 | Exceptional $46,387 |
| Afghans | 94.9 /100 | #114 | Exceptional $46,268 |
| Immigrants | Chile | 94.6 /100 | #115 | Exceptional $46,213 |
| Poles | 94.1 /100 | #116 | Exceptional $46,123 |
| Chinese | 93.9 /100 | #117 | Exceptional $46,098 |
| Immigrants | Saudi Arabia | 93.3 /100 | #118 | Exceptional $46,008 |
| Immigrants | Poland | 93.1 /100 | #119 | Exceptional $45,979 |
Demographics Similar to Sudanese by Per Capita Income
In terms of per capita income, the demographic groups most similar to Sudanese are Tongan ($41,693, a difference of 0.010%), Immigrants from Bangladesh ($41,709, a difference of 0.030%), Guamanian/Chamorro ($41,678, a difference of 0.040%), Immigrants from Venezuela ($41,727, a difference of 0.080%), and Trinidadian and Tobagonian ($41,655, a difference of 0.10%).
| Demographics | Rating | Rank | Per Capita Income |
| Panamanians | 13.9 /100 | #208 | Poor $42,035 |
| Immigrants | Sudan | 13.2 /100 | #209 | Poor $41,986 |
| Ecuadorians | 12.9 /100 | #210 | Poor $41,958 |
| Immigrants | Panama | 11.6 /100 | #211 | Poor $41,853 |
| Immigrants | Senegal | 11.3 /100 | #212 | Poor $41,830 |
| Immigrants | Venezuela | 10.2 /100 | #213 | Poor $41,727 |
| Immigrants | Bangladesh | 10.1 /100 | #214 | Poor $41,709 |
| Sudanese | 9.9 /100 | #215 | Tragic $41,695 |
| Tongans | 9.9 /100 | #216 | Tragic $41,693 |
| Guamanians/Chamorros | 9.7 /100 | #217 | Tragic $41,678 |
| Trinidadians and Tobagonians | 9.5 /100 | #218 | Tragic $41,655 |
| Puget Sound Salish | 8.1 /100 | #219 | Tragic $41,495 |
| Immigrants | Barbados | 7.9 /100 | #220 | Tragic $41,478 |
| Immigrants | Trinidad and Tobago | 7.9 /100 | #221 | Tragic $41,476 |
| Immigrants | Iraq | 7.1 /100 | #222 | Tragic $41,365 |