Immigrants from Fiji vs Inupiat Per Capita Income
COMPARE
Immigrants from Fiji
Inupiat
Per Capita Income
Per Capita Income Comparison
Immigrants from Fiji
Inupiat
$42,694
PER CAPITA INCOME
25.2/ 100
METRIC RATING
194th/ 347
METRIC RANK
$36,999
PER CAPITA INCOME
0.1/ 100
METRIC RATING
305th/ 347
METRIC RANK
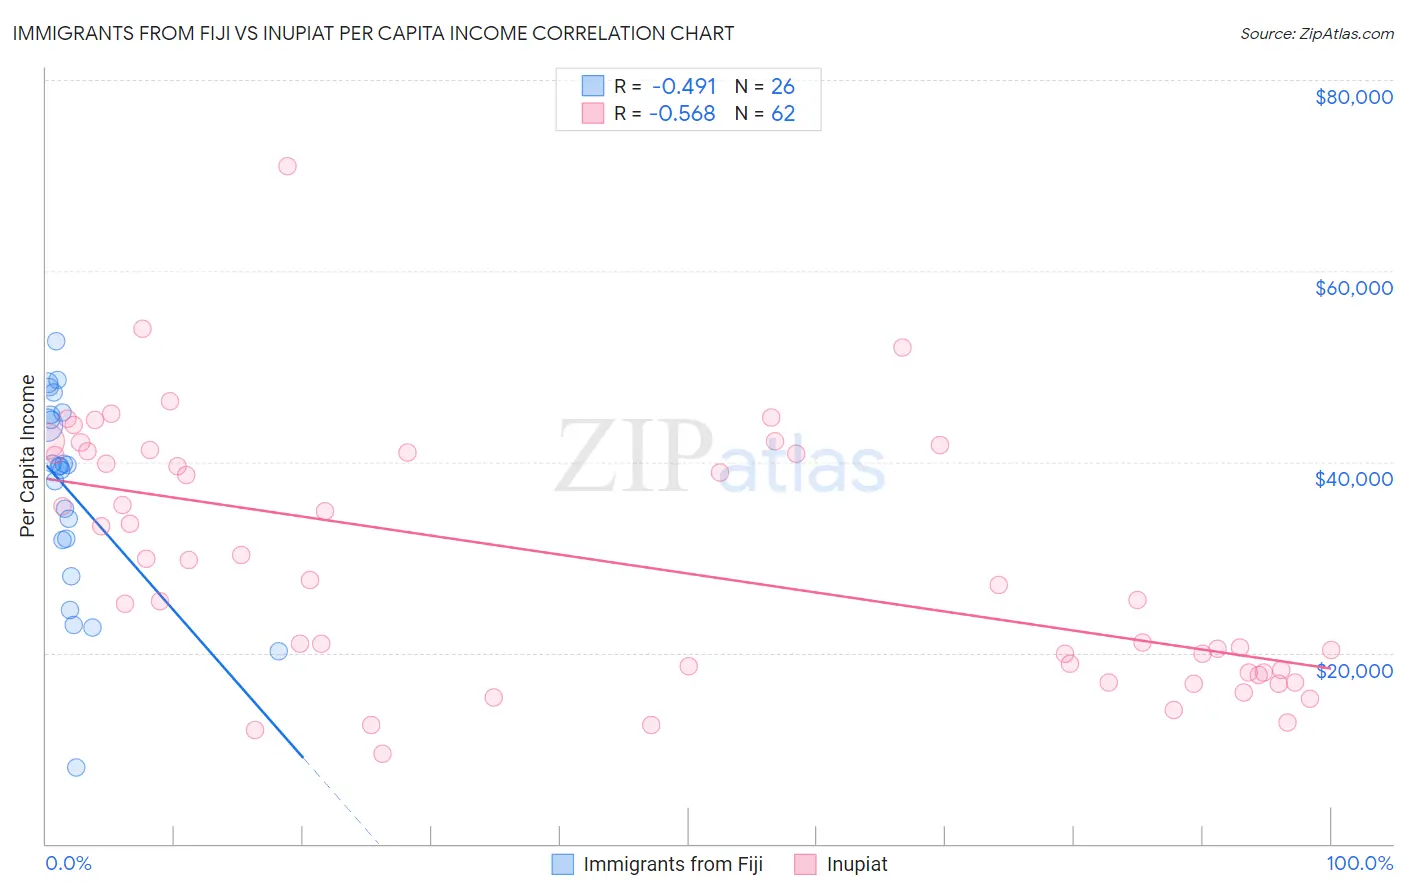
Immigrants from Fiji vs Inupiat Per Capita Income Correlation Chart
The statistical analysis conducted on geographies consisting of 93,756,204 people shows a moderate negative correlation between the proportion of Immigrants from Fiji and per capita income in the United States with a correlation coefficient (R) of -0.491 and weighted average of $42,694. Similarly, the statistical analysis conducted on geographies consisting of 96,349,338 people shows a substantial negative correlation between the proportion of Inupiat and per capita income in the United States with a correlation coefficient (R) of -0.568 and weighted average of $36,999, a difference of 15.4%.
Per Capita Income Correlation Summary
| Measurement | Immigrants from Fiji | Inupiat |
| Minimum | $8,026 | $9,481 |
| Maximum | $52,700 | $71,025 |
| Range | $44,674 | $61,544 |
| Mean | $36,824 | $29,494 |
| Median | $39,532 | $27,374 |
| Interquartile 25% (IQ1) | $31,785 | $17,924 |
| Interquartile 75% (IQ3) | $44,942 | $40,952 |
| Interquartile Range (IQR) | $13,157 | $23,028 |
| Standard Deviation (Sample) | $10,646 | $13,151 |
| Standard Deviation (Population) | $10,440 | $13,045 |
Similar Demographics by Per Capita Income
Demographics Similar to Immigrants from Fiji by Per Capita Income
In terms of per capita income, the demographic groups most similar to Immigrants from Fiji are Immigrants from Kenya ($42,661, a difference of 0.080%), Immigrants from Sierra Leone ($42,752, a difference of 0.13%), Iraqi ($42,760, a difference of 0.16%), Dutch ($42,605, a difference of 0.21%), and Yugoslavian ($42,792, a difference of 0.23%).
| Demographics | Rating | Rank | Per Capita Income |
| Immigrants | Colombia | 31.5 /100 | #187 | Fair $42,971 |
| Immigrants | Africa | 31.0 /100 | #188 | Fair $42,950 |
| Bermudans | 30.1 /100 | #189 | Fair $42,911 |
| Kenyans | 27.7 /100 | #190 | Fair $42,808 |
| Yugoslavians | 27.4 /100 | #191 | Fair $42,792 |
| Iraqis | 26.7 /100 | #192 | Fair $42,760 |
| Immigrants | Sierra Leone | 26.5 /100 | #193 | Fair $42,752 |
| Immigrants | Fiji | 25.2 /100 | #194 | Fair $42,694 |
| Immigrants | Kenya | 24.5 /100 | #195 | Fair $42,661 |
| Dutch | 23.4 /100 | #196 | Fair $42,605 |
| Scotch-Irish | 22.6 /100 | #197 | Fair $42,563 |
| Immigrants | Portugal | 19.7 /100 | #198 | Poor $42,412 |
| Barbadians | 19.6 /100 | #199 | Poor $42,406 |
| Vietnamese | 19.0 /100 | #200 | Poor $42,368 |
| Immigrants | Thailand | 17.6 /100 | #201 | Poor $42,289 |
Demographics Similar to Inupiat by Per Capita Income
In terms of per capita income, the demographic groups most similar to Inupiat are Honduran ($37,031, a difference of 0.080%), Paiute ($37,066, a difference of 0.18%), Shoshone ($37,072, a difference of 0.20%), Ottawa ($37,101, a difference of 0.28%), and Immigrants from Haiti ($36,849, a difference of 0.41%).
| Demographics | Rating | Rank | Per Capita Income |
| Immigrants | Caribbean | 0.1 /100 | #298 | Tragic $37,254 |
| Cherokee | 0.1 /100 | #299 | Tragic $37,203 |
| Immigrants | Bahamas | 0.1 /100 | #300 | Tragic $37,193 |
| Ottawa | 0.1 /100 | #301 | Tragic $37,101 |
| Shoshone | 0.1 /100 | #302 | Tragic $37,072 |
| Paiute | 0.1 /100 | #303 | Tragic $37,066 |
| Hondurans | 0.1 /100 | #304 | Tragic $37,031 |
| Inupiat | 0.1 /100 | #305 | Tragic $36,999 |
| Immigrants | Haiti | 0.0 /100 | #306 | Tragic $36,849 |
| Immigrants | Latin America | 0.0 /100 | #307 | Tragic $36,823 |
| Fijians | 0.0 /100 | #308 | Tragic $36,690 |
| Immigrants | Honduras | 0.0 /100 | #309 | Tragic $36,665 |
| Ute | 0.0 /100 | #310 | Tragic $36,651 |
| Chippewa | 0.0 /100 | #311 | Tragic $36,631 |
| Chickasaw | 0.0 /100 | #312 | Tragic $36,475 |