Immigrants from Guyana vs Sudanese Per Capita Income
COMPARE
Immigrants from Guyana
Sudanese
Per Capita Income
Per Capita Income Comparison
Immigrants from Guyana
Sudanese
$40,742
PER CAPITA INCOME
3.6/ 100
METRIC RATING
235th/ 347
METRIC RANK
$41,695
PER CAPITA INCOME
9.9/ 100
METRIC RATING
215th/ 347
METRIC RANK
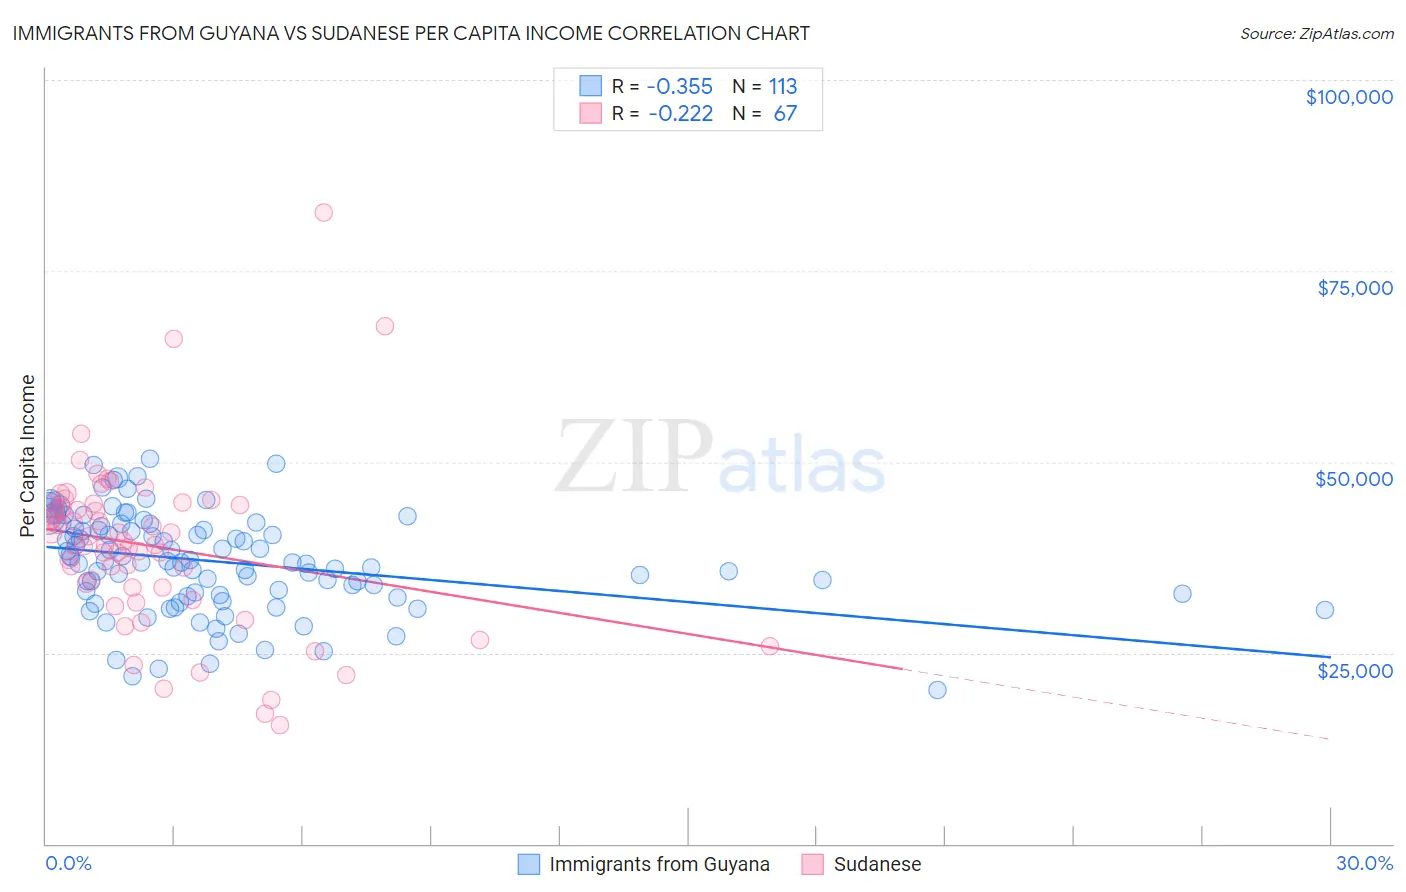
Immigrants from Guyana vs Sudanese Per Capita Income Correlation Chart
The statistical analysis conducted on geographies consisting of 183,742,461 people shows a mild negative correlation between the proportion of Immigrants from Guyana and per capita income in the United States with a correlation coefficient (R) of -0.355 and weighted average of $40,742. Similarly, the statistical analysis conducted on geographies consisting of 110,152,165 people shows a weak negative correlation between the proportion of Sudanese and per capita income in the United States with a correlation coefficient (R) of -0.222 and weighted average of $41,695, a difference of 2.3%.
Per Capita Income Correlation Summary
| Measurement | Immigrants from Guyana | Sudanese |
| Minimum | $20,131 | $15,628 |
| Maximum | $50,352 | $82,685 |
| Range | $30,221 | $67,057 |
| Mean | $36,982 | $38,981 |
| Median | $36,920 | $39,137 |
| Interquartile 25% (IQ1) | $32,654 | $33,494 |
| Interquartile 75% (IQ3) | $41,898 | $44,276 |
| Interquartile Range (IQR) | $9,245 | $10,782 |
| Standard Deviation (Sample) | $6,465 | $11,237 |
| Standard Deviation (Population) | $6,436 | $11,153 |
Demographics Similar to Immigrants from Guyana and Sudanese by Per Capita Income
In terms of per capita income, the demographic groups most similar to Immigrants from Guyana are Immigrants from West Indies ($40,763, a difference of 0.050%), Delaware ($40,778, a difference of 0.090%), Guyanese ($40,949, a difference of 0.51%), Senegalese ($41,000, a difference of 0.63%), and Native Hawaiian ($41,017, a difference of 0.67%). Similarly, the demographic groups most similar to Sudanese are Tongan ($41,693, a difference of 0.010%), Guamanian/Chamorro ($41,678, a difference of 0.040%), Trinidadian and Tobagonian ($41,655, a difference of 0.10%), Puget Sound Salish ($41,495, a difference of 0.48%), and Immigrants from Barbados ($41,478, a difference of 0.52%).
| Demographics | Rating | Rank | Per Capita Income |
| Sudanese | 9.9 /100 | #215 | Tragic $41,695 |
| Tongans | 9.9 /100 | #216 | Tragic $41,693 |
| Guamanians/Chamorros | 9.7 /100 | #217 | Tragic $41,678 |
| Trinidadians and Tobagonians | 9.5 /100 | #218 | Tragic $41,655 |
| Puget Sound Salish | 8.1 /100 | #219 | Tragic $41,495 |
| Immigrants | Barbados | 7.9 /100 | #220 | Tragic $41,478 |
| Immigrants | Trinidad and Tobago | 7.9 /100 | #221 | Tragic $41,476 |
| Immigrants | Iraq | 7.1 /100 | #222 | Tragic $41,365 |
| Immigrants | Cameroon | 6.8 /100 | #223 | Tragic $41,334 |
| Immigrants | St. Vincent and the Grenadines | 6.4 /100 | #224 | Tragic $41,270 |
| West Indians | 6.0 /100 | #225 | Tragic $41,217 |
| Immigrants | Ecuador | 5.9 /100 | #226 | Tragic $41,195 |
| Immigrants | Ghana | 5.5 /100 | #227 | Tragic $41,131 |
| Immigrants | Grenada | 5.5 /100 | #228 | Tragic $41,123 |
| Nigerians | 4.9 /100 | #229 | Tragic $41,026 |
| Native Hawaiians | 4.9 /100 | #230 | Tragic $41,017 |
| Senegalese | 4.8 /100 | #231 | Tragic $41,000 |
| Guyanese | 4.5 /100 | #232 | Tragic $40,949 |
| Delaware | 3.8 /100 | #233 | Tragic $40,778 |
| Immigrants | West Indies | 3.7 /100 | #234 | Tragic $40,763 |
| Immigrants | Guyana | 3.6 /100 | #235 | Tragic $40,742 |