Immigrants from Fiji vs Yup'ik Per Capita Income
COMPARE
Immigrants from Fiji
Yup'ik
Per Capita Income
Per Capita Income Comparison
Immigrants from Fiji
Yup'ik
$42,694
PER CAPITA INCOME
25.2/ 100
METRIC RATING
194th/ 347
METRIC RANK
$30,518
PER CAPITA INCOME
0.0/ 100
METRIC RATING
344th/ 347
METRIC RANK
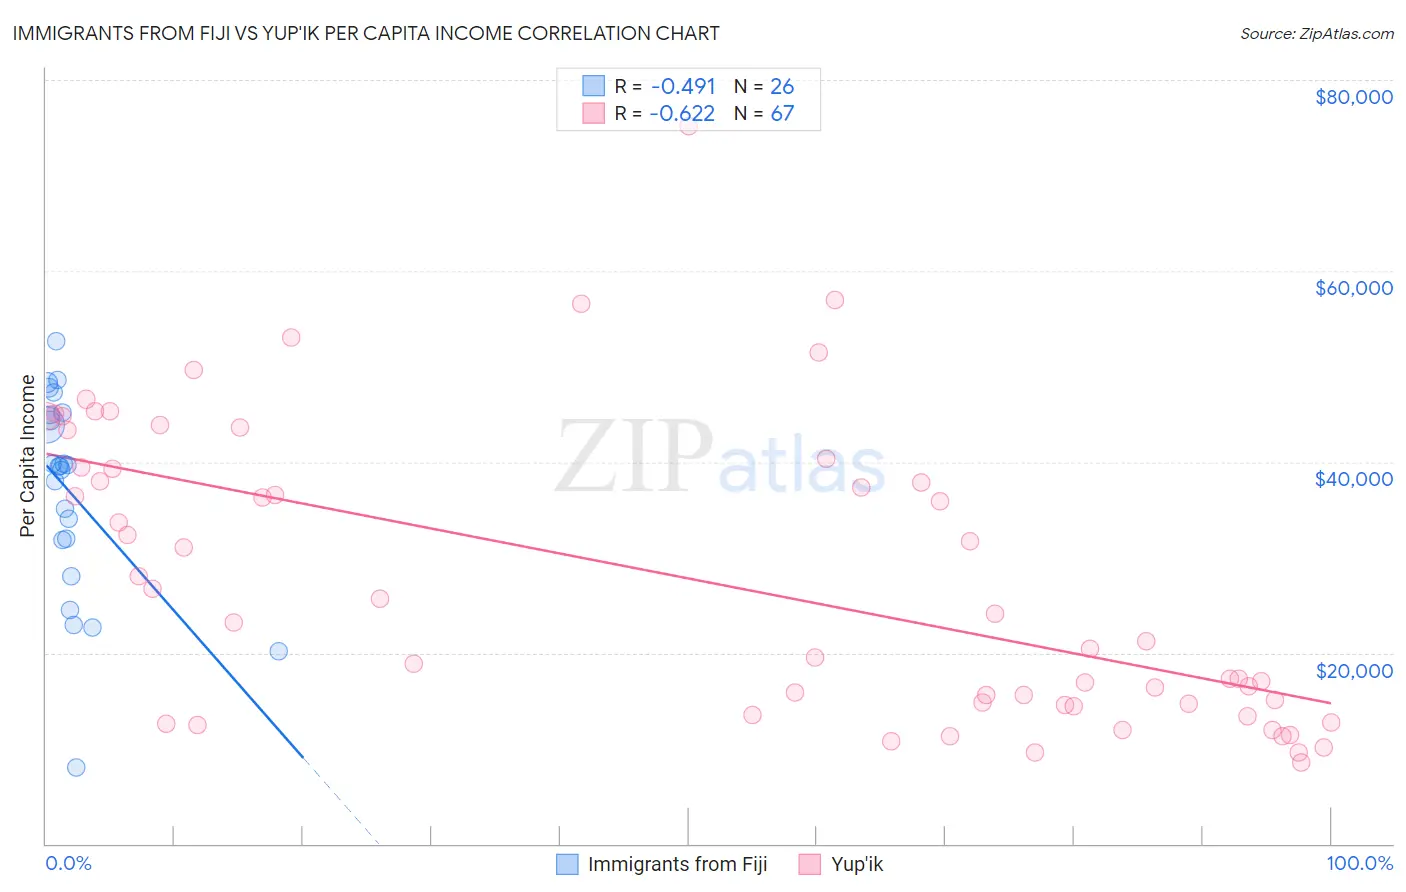
Immigrants from Fiji vs Yup'ik Per Capita Income Correlation Chart
The statistical analysis conducted on geographies consisting of 93,756,204 people shows a moderate negative correlation between the proportion of Immigrants from Fiji and per capita income in the United States with a correlation coefficient (R) of -0.491 and weighted average of $42,694. Similarly, the statistical analysis conducted on geographies consisting of 39,964,789 people shows a significant negative correlation between the proportion of Yup'ik and per capita income in the United States with a correlation coefficient (R) of -0.622 and weighted average of $30,518, a difference of 39.9%.
Per Capita Income Correlation Summary
| Measurement | Immigrants from Fiji | Yup'ik |
| Minimum | $8,026 | $8,508 |
| Maximum | $52,700 | $75,144 |
| Range | $44,674 | $66,636 |
| Mean | $36,824 | $27,634 |
| Median | $39,532 | $23,141 |
| Interquartile 25% (IQ1) | $31,785 | $14,540 |
| Interquartile 75% (IQ3) | $44,942 | $39,384 |
| Interquartile Range (IQR) | $13,157 | $24,844 |
| Standard Deviation (Sample) | $10,646 | $15,386 |
| Standard Deviation (Population) | $10,440 | $15,271 |
Similar Demographics by Per Capita Income
Demographics Similar to Immigrants from Fiji by Per Capita Income
In terms of per capita income, the demographic groups most similar to Immigrants from Fiji are Immigrants from Kenya ($42,661, a difference of 0.080%), Immigrants from Sierra Leone ($42,752, a difference of 0.13%), Iraqi ($42,760, a difference of 0.16%), Dutch ($42,605, a difference of 0.21%), and Yugoslavian ($42,792, a difference of 0.23%).
| Demographics | Rating | Rank | Per Capita Income |
| Immigrants | Colombia | 31.5 /100 | #187 | Fair $42,971 |
| Immigrants | Africa | 31.0 /100 | #188 | Fair $42,950 |
| Bermudans | 30.1 /100 | #189 | Fair $42,911 |
| Kenyans | 27.7 /100 | #190 | Fair $42,808 |
| Yugoslavians | 27.4 /100 | #191 | Fair $42,792 |
| Iraqis | 26.7 /100 | #192 | Fair $42,760 |
| Immigrants | Sierra Leone | 26.5 /100 | #193 | Fair $42,752 |
| Immigrants | Fiji | 25.2 /100 | #194 | Fair $42,694 |
| Immigrants | Kenya | 24.5 /100 | #195 | Fair $42,661 |
| Dutch | 23.4 /100 | #196 | Fair $42,605 |
| Scotch-Irish | 22.6 /100 | #197 | Fair $42,563 |
| Immigrants | Portugal | 19.7 /100 | #198 | Poor $42,412 |
| Barbadians | 19.6 /100 | #199 | Poor $42,406 |
| Vietnamese | 19.0 /100 | #200 | Poor $42,368 |
| Immigrants | Thailand | 17.6 /100 | #201 | Poor $42,289 |
Demographics Similar to Yup'ik by Per Capita Income
In terms of per capita income, the demographic groups most similar to Yup'ik are Pima ($30,644, a difference of 0.41%), Tohono O'odham ($30,256, a difference of 0.87%), Hopi ($31,177, a difference of 2.2%), Lumbee ($29,845, a difference of 2.3%), and Puerto Rican ($31,268, a difference of 2.5%).
| Demographics | Rating | Rank | Per Capita Income |
| Immigrants | Yemen | 0.0 /100 | #333 | Tragic $33,696 |
| Natives/Alaskans | 0.0 /100 | #334 | Tragic $33,279 |
| Yuman | 0.0 /100 | #335 | Tragic $33,236 |
| Yakama | 0.0 /100 | #336 | Tragic $33,009 |
| Houma | 0.0 /100 | #337 | Tragic $32,996 |
| Arapaho | 0.0 /100 | #338 | Tragic $32,345 |
| Pueblo | 0.0 /100 | #339 | Tragic $32,012 |
| Crow | 0.0 /100 | #340 | Tragic $31,729 |
| Puerto Ricans | 0.0 /100 | #341 | Tragic $31,268 |
| Hopi | 0.0 /100 | #342 | Tragic $31,177 |
| Pima | 0.0 /100 | #343 | Tragic $30,644 |
| Yup'ik | 0.0 /100 | #344 | Tragic $30,518 |
| Tohono O'odham | 0.0 /100 | #345 | Tragic $30,256 |
| Lumbee | 0.0 /100 | #346 | Tragic $29,845 |
| Navajo | 0.0 /100 | #347 | Tragic $29,031 |