Swiss vs Sudanese Per Capita Income
COMPARE
Swiss
Sudanese
Per Capita Income
Per Capita Income Comparison
Swiss
Sudanese
$44,076
PER CAPITA INCOME
61.4/ 100
METRIC RATING
162nd/ 347
METRIC RANK
$41,695
PER CAPITA INCOME
9.9/ 100
METRIC RATING
215th/ 347
METRIC RANK
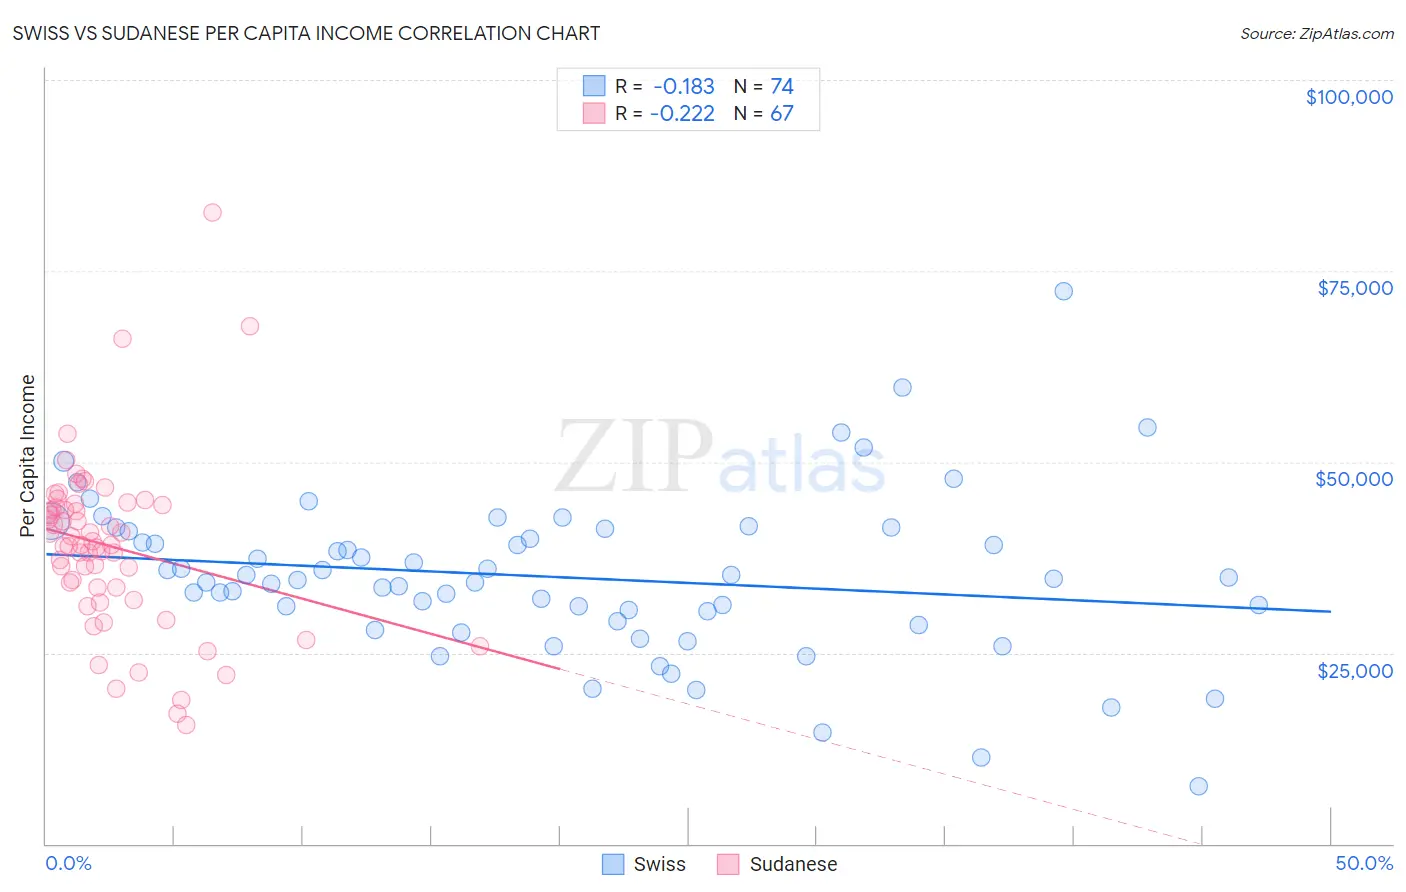
Swiss vs Sudanese Per Capita Income Correlation Chart
The statistical analysis conducted on geographies consisting of 465,046,505 people shows a poor negative correlation between the proportion of Swiss and per capita income in the United States with a correlation coefficient (R) of -0.183 and weighted average of $44,076. Similarly, the statistical analysis conducted on geographies consisting of 110,152,165 people shows a weak negative correlation between the proportion of Sudanese and per capita income in the United States with a correlation coefficient (R) of -0.222 and weighted average of $41,695, a difference of 5.7%.
Per Capita Income Correlation Summary
| Measurement | Swiss | Sudanese |
| Minimum | $7,533 | $15,628 |
| Maximum | $72,391 | $82,685 |
| Range | $64,858 | $67,057 |
| Mean | $34,911 | $38,981 |
| Median | $34,649 | $39,137 |
| Interquartile 25% (IQ1) | $29,057 | $33,494 |
| Interquartile 75% (IQ3) | $40,868 | $44,276 |
| Interquartile Range (IQR) | $11,811 | $10,782 |
| Standard Deviation (Sample) | $10,600 | $11,237 |
| Standard Deviation (Population) | $10,528 | $11,153 |
Similar Demographics by Per Capita Income
Demographics Similar to Swiss by Per Capita Income
In terms of per capita income, the demographic groups most similar to Swiss are Immigrants from South America ($44,068, a difference of 0.020%), Costa Rican ($44,090, a difference of 0.030%), Danish ($44,095, a difference of 0.040%), South American ($44,114, a difference of 0.090%), and Sri Lankan ($44,014, a difference of 0.14%).
| Demographics | Rating | Rank | Per Capita Income |
| Uruguayans | 67.6 /100 | #155 | Good $44,318 |
| Slovaks | 65.4 /100 | #156 | Good $44,229 |
| South American Indians | 64.8 /100 | #157 | Good $44,206 |
| Immigrants | Nepal | 64.3 /100 | #158 | Good $44,187 |
| South Americans | 62.4 /100 | #159 | Good $44,114 |
| Danes | 61.9 /100 | #160 | Good $44,095 |
| Costa Ricans | 61.8 /100 | #161 | Good $44,090 |
| Swiss | 61.4 /100 | #162 | Good $44,076 |
| Immigrants | South America | 61.2 /100 | #163 | Good $44,068 |
| Sri Lankans | 59.8 /100 | #164 | Average $44,014 |
| Immigrants | Philippines | 59.4 /100 | #165 | Average $44,000 |
| Immigrants | Uruguay | 59.3 /100 | #166 | Average $43,997 |
| English | 58.9 /100 | #167 | Average $43,982 |
| Belgians | 58.1 /100 | #168 | Average $43,951 |
| Immigrants | Peru | 55.3 /100 | #169 | Average $43,852 |
Demographics Similar to Sudanese by Per Capita Income
In terms of per capita income, the demographic groups most similar to Sudanese are Tongan ($41,693, a difference of 0.010%), Immigrants from Bangladesh ($41,709, a difference of 0.030%), Guamanian/Chamorro ($41,678, a difference of 0.040%), Immigrants from Venezuela ($41,727, a difference of 0.080%), and Trinidadian and Tobagonian ($41,655, a difference of 0.10%).
| Demographics | Rating | Rank | Per Capita Income |
| Panamanians | 13.9 /100 | #208 | Poor $42,035 |
| Immigrants | Sudan | 13.2 /100 | #209 | Poor $41,986 |
| Ecuadorians | 12.9 /100 | #210 | Poor $41,958 |
| Immigrants | Panama | 11.6 /100 | #211 | Poor $41,853 |
| Immigrants | Senegal | 11.3 /100 | #212 | Poor $41,830 |
| Immigrants | Venezuela | 10.2 /100 | #213 | Poor $41,727 |
| Immigrants | Bangladesh | 10.1 /100 | #214 | Poor $41,709 |
| Sudanese | 9.9 /100 | #215 | Tragic $41,695 |
| Tongans | 9.9 /100 | #216 | Tragic $41,693 |
| Guamanians/Chamorros | 9.7 /100 | #217 | Tragic $41,678 |
| Trinidadians and Tobagonians | 9.5 /100 | #218 | Tragic $41,655 |
| Puget Sound Salish | 8.1 /100 | #219 | Tragic $41,495 |
| Immigrants | Barbados | 7.9 /100 | #220 | Tragic $41,478 |
| Immigrants | Trinidad and Tobago | 7.9 /100 | #221 | Tragic $41,476 |
| Immigrants | Iraq | 7.1 /100 | #222 | Tragic $41,365 |