Immigrants from Fiji vs Immigrants from Cuba Per Capita Income
COMPARE
Immigrants from Fiji
Immigrants from Cuba
Per Capita Income
Per Capita Income Comparison
Immigrants from Fiji
Immigrants from Cuba
$42,694
PER CAPITA INCOME
25.2/ 100
METRIC RATING
194th/ 347
METRIC RANK
$34,910
PER CAPITA INCOME
0.0/ 100
METRIC RATING
326th/ 347
METRIC RANK
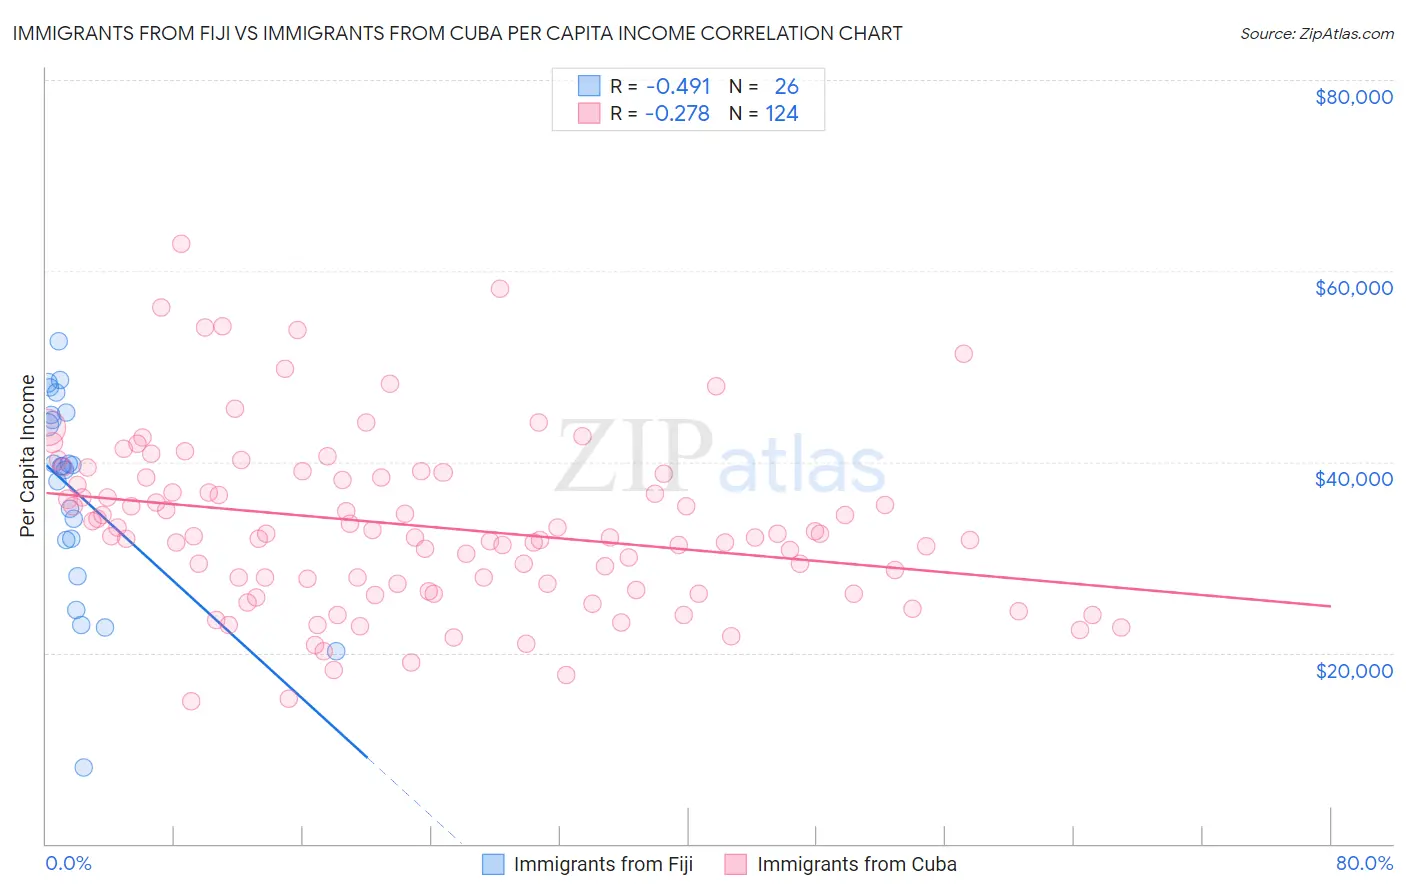
Immigrants from Fiji vs Immigrants from Cuba Per Capita Income Correlation Chart
The statistical analysis conducted on geographies consisting of 93,756,204 people shows a moderate negative correlation between the proportion of Immigrants from Fiji and per capita income in the United States with a correlation coefficient (R) of -0.491 and weighted average of $42,694. Similarly, the statistical analysis conducted on geographies consisting of 325,884,272 people shows a weak negative correlation between the proportion of Immigrants from Cuba and per capita income in the United States with a correlation coefficient (R) of -0.278 and weighted average of $34,910, a difference of 22.3%.
Per Capita Income Correlation Summary
| Measurement | Immigrants from Fiji | Immigrants from Cuba |
| Minimum | $8,026 | $14,936 |
| Maximum | $52,700 | $62,804 |
| Range | $44,674 | $47,868 |
| Mean | $36,824 | $33,273 |
| Median | $39,532 | $32,226 |
| Interquartile 25% (IQ1) | $31,785 | $26,888 |
| Interquartile 75% (IQ3) | $44,942 | $38,343 |
| Interquartile Range (IQR) | $13,157 | $11,455 |
| Standard Deviation (Sample) | $10,646 | $9,025 |
| Standard Deviation (Population) | $10,440 | $8,989 |
Similar Demographics by Per Capita Income
Demographics Similar to Immigrants from Fiji by Per Capita Income
In terms of per capita income, the demographic groups most similar to Immigrants from Fiji are Immigrants from Kenya ($42,661, a difference of 0.080%), Immigrants from Sierra Leone ($42,752, a difference of 0.13%), Iraqi ($42,760, a difference of 0.16%), Dutch ($42,605, a difference of 0.21%), and Yugoslavian ($42,792, a difference of 0.23%).
| Demographics | Rating | Rank | Per Capita Income |
| Immigrants | Colombia | 31.5 /100 | #187 | Fair $42,971 |
| Immigrants | Africa | 31.0 /100 | #188 | Fair $42,950 |
| Bermudans | 30.1 /100 | #189 | Fair $42,911 |
| Kenyans | 27.7 /100 | #190 | Fair $42,808 |
| Yugoslavians | 27.4 /100 | #191 | Fair $42,792 |
| Iraqis | 26.7 /100 | #192 | Fair $42,760 |
| Immigrants | Sierra Leone | 26.5 /100 | #193 | Fair $42,752 |
| Immigrants | Fiji | 25.2 /100 | #194 | Fair $42,694 |
| Immigrants | Kenya | 24.5 /100 | #195 | Fair $42,661 |
| Dutch | 23.4 /100 | #196 | Fair $42,605 |
| Scotch-Irish | 22.6 /100 | #197 | Fair $42,563 |
| Immigrants | Portugal | 19.7 /100 | #198 | Poor $42,412 |
| Barbadians | 19.6 /100 | #199 | Poor $42,406 |
| Vietnamese | 19.0 /100 | #200 | Poor $42,368 |
| Immigrants | Thailand | 17.6 /100 | #201 | Poor $42,289 |
Demographics Similar to Immigrants from Cuba by Per Capita Income
In terms of per capita income, the demographic groups most similar to Immigrants from Cuba are Apache ($34,886, a difference of 0.070%), Immigrants from Central America ($34,974, a difference of 0.18%), Kiowa ($35,102, a difference of 0.55%), Menominee ($34,578, a difference of 0.96%), and Mexican ($34,559, a difference of 1.0%).
| Demographics | Rating | Rank | Per Capita Income |
| Immigrants | Congo | 0.0 /100 | #319 | Tragic $35,720 |
| Hispanics or Latinos | 0.0 /100 | #320 | Tragic $35,688 |
| Blacks/African Americans | 0.0 /100 | #321 | Tragic $35,564 |
| Creek | 0.0 /100 | #322 | Tragic $35,546 |
| Cheyenne | 0.0 /100 | #323 | Tragic $35,276 |
| Kiowa | 0.0 /100 | #324 | Tragic $35,102 |
| Immigrants | Central America | 0.0 /100 | #325 | Tragic $34,974 |
| Immigrants | Cuba | 0.0 /100 | #326 | Tragic $34,910 |
| Apache | 0.0 /100 | #327 | Tragic $34,886 |
| Menominee | 0.0 /100 | #328 | Tragic $34,578 |
| Mexicans | 0.0 /100 | #329 | Tragic $34,559 |
| Spanish American Indians | 0.0 /100 | #330 | Tragic $34,195 |
| Immigrants | Mexico | 0.0 /100 | #331 | Tragic $33,931 |
| Sioux | 0.0 /100 | #332 | Tragic $33,921 |
| Immigrants | Yemen | 0.0 /100 | #333 | Tragic $33,696 |