Immigrants from Europe vs Lumbee Median Household Income
COMPARE
Immigrants from Europe
Lumbee
Median Household Income
Median Household Income Comparison
Immigrants from Europe
Lumbee
$95,032
MEDIAN HOUSEHOLD INCOME
99.8/ 100
METRIC RATING
59th/ 347
METRIC RANK
$54,644
MEDIAN HOUSEHOLD INCOME
0.0/ 100
METRIC RATING
347th/ 347
METRIC RANK
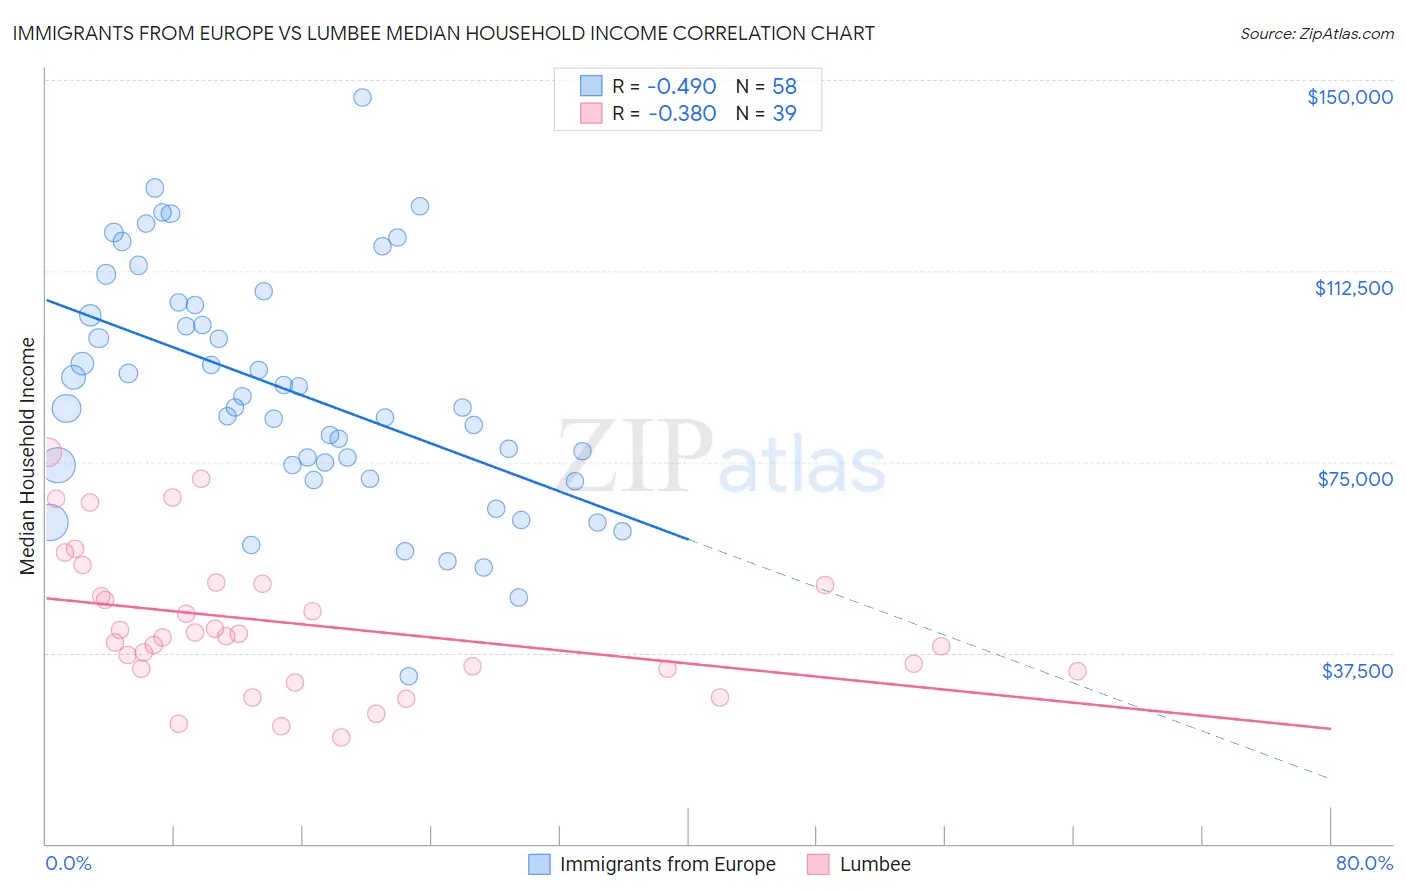
Immigrants from Europe vs Lumbee Median Household Income Correlation Chart
The statistical analysis conducted on geographies consisting of 546,586,899 people shows a moderate negative correlation between the proportion of Immigrants from Europe and median household income in the United States with a correlation coefficient (R) of -0.490 and weighted average of $95,032. Similarly, the statistical analysis conducted on geographies consisting of 92,249,872 people shows a mild negative correlation between the proportion of Lumbee and median household income in the United States with a correlation coefficient (R) of -0.380 and weighted average of $54,644, a difference of 73.9%.
Median Household Income Correlation Summary
| Measurement | Immigrants from Europe | Lumbee |
| Minimum | $32,853 | $20,917 |
| Maximum | $146,675 | $76,919 |
| Range | $113,822 | $56,002 |
| Mean | $88,761 | $43,208 |
| Median | $85,626 | $40,857 |
| Interquartile 25% (IQ1) | $74,349 | $34,279 |
| Interquartile 75% (IQ3) | $105,928 | $51,174 |
| Interquartile Range (IQR) | $31,579 | $16,895 |
| Standard Deviation (Sample) | $23,344 | $13,998 |
| Standard Deviation (Population) | $23,142 | $13,817 |
Similar Demographics by Median Household Income
Demographics Similar to Immigrants from Europe by Median Household Income
In terms of median household income, the demographic groups most similar to Immigrants from Europe are Korean ($95,018, a difference of 0.020%), Laotian ($94,990, a difference of 0.040%), Soviet Union ($95,098, a difference of 0.070%), New Zealander ($95,146, a difference of 0.12%), and Immigrants from Norway ($94,846, a difference of 0.20%).
| Demographics | Rating | Rank | Median Household Income |
| Immigrants | South Africa | 99.9 /100 | #52 | Exceptional $95,800 |
| Paraguayans | 99.9 /100 | #53 | Exceptional $95,737 |
| Egyptians | 99.9 /100 | #54 | Exceptional $95,673 |
| Immigrants | Czechoslovakia | 99.9 /100 | #55 | Exceptional $95,319 |
| Immigrants | Austria | 99.9 /100 | #56 | Exceptional $95,277 |
| New Zealanders | 99.8 /100 | #57 | Exceptional $95,146 |
| Soviet Union | 99.8 /100 | #58 | Exceptional $95,098 |
| Immigrants | Europe | 99.8 /100 | #59 | Exceptional $95,032 |
| Koreans | 99.8 /100 | #60 | Exceptional $95,018 |
| Laotians | 99.8 /100 | #61 | Exceptional $94,990 |
| Immigrants | Norway | 99.8 /100 | #62 | Exceptional $94,846 |
| Greeks | 99.8 /100 | #63 | Exceptional $94,735 |
| Immigrants | Netherlands | 99.7 /100 | #64 | Exceptional $94,411 |
| Immigrants | Belarus | 99.7 /100 | #65 | Exceptional $94,399 |
| Immigrants | Romania | 99.7 /100 | #66 | Exceptional $94,222 |
Demographics Similar to Lumbee by Median Household Income
In terms of median household income, the demographic groups most similar to Lumbee are Navajo ($59,159, a difference of 8.3%), Puerto Rican ($59,197, a difference of 8.3%), Tohono O'odham ($61,663, a difference of 12.8%), Houma ($62,575, a difference of 14.5%), and Pima ($63,262, a difference of 15.8%).
| Demographics | Rating | Rank | Median Household Income |
| Creek | 0.0 /100 | #333 | Tragic $67,715 |
| Blacks/African Americans | 0.0 /100 | #334 | Tragic $67,573 |
| Cheyenne | 0.0 /100 | #335 | Tragic $66,974 |
| Immigrants | Congo | 0.0 /100 | #336 | Tragic $66,768 |
| Kiowa | 0.0 /100 | #337 | Tragic $65,914 |
| Immigrants | Yemen | 0.0 /100 | #338 | Tragic $65,194 |
| Hopi | 0.0 /100 | #339 | Tragic $65,043 |
| Pueblo | 0.0 /100 | #340 | Tragic $64,692 |
| Crow | 0.0 /100 | #341 | Tragic $63,681 |
| Pima | 0.0 /100 | #342 | Tragic $63,262 |
| Houma | 0.0 /100 | #343 | Tragic $62,575 |
| Tohono O'odham | 0.0 /100 | #344 | Tragic $61,663 |
| Puerto Ricans | 0.0 /100 | #345 | Tragic $59,197 |
| Navajo | 0.0 /100 | #346 | Tragic $59,159 |
| Lumbee | 0.0 /100 | #347 | Tragic $54,644 |