Immigrants from Europe vs Yaqui Median Household Income
COMPARE
Immigrants from Europe
Yaqui
Median Household Income
Median Household Income Comparison
Immigrants from Europe
Yaqui
$95,032
MEDIAN HOUSEHOLD INCOME
99.8/ 100
METRIC RATING
59th/ 347
METRIC RANK
$74,596
MEDIAN HOUSEHOLD INCOME
0.1/ 100
METRIC RATING
284th/ 347
METRIC RANK
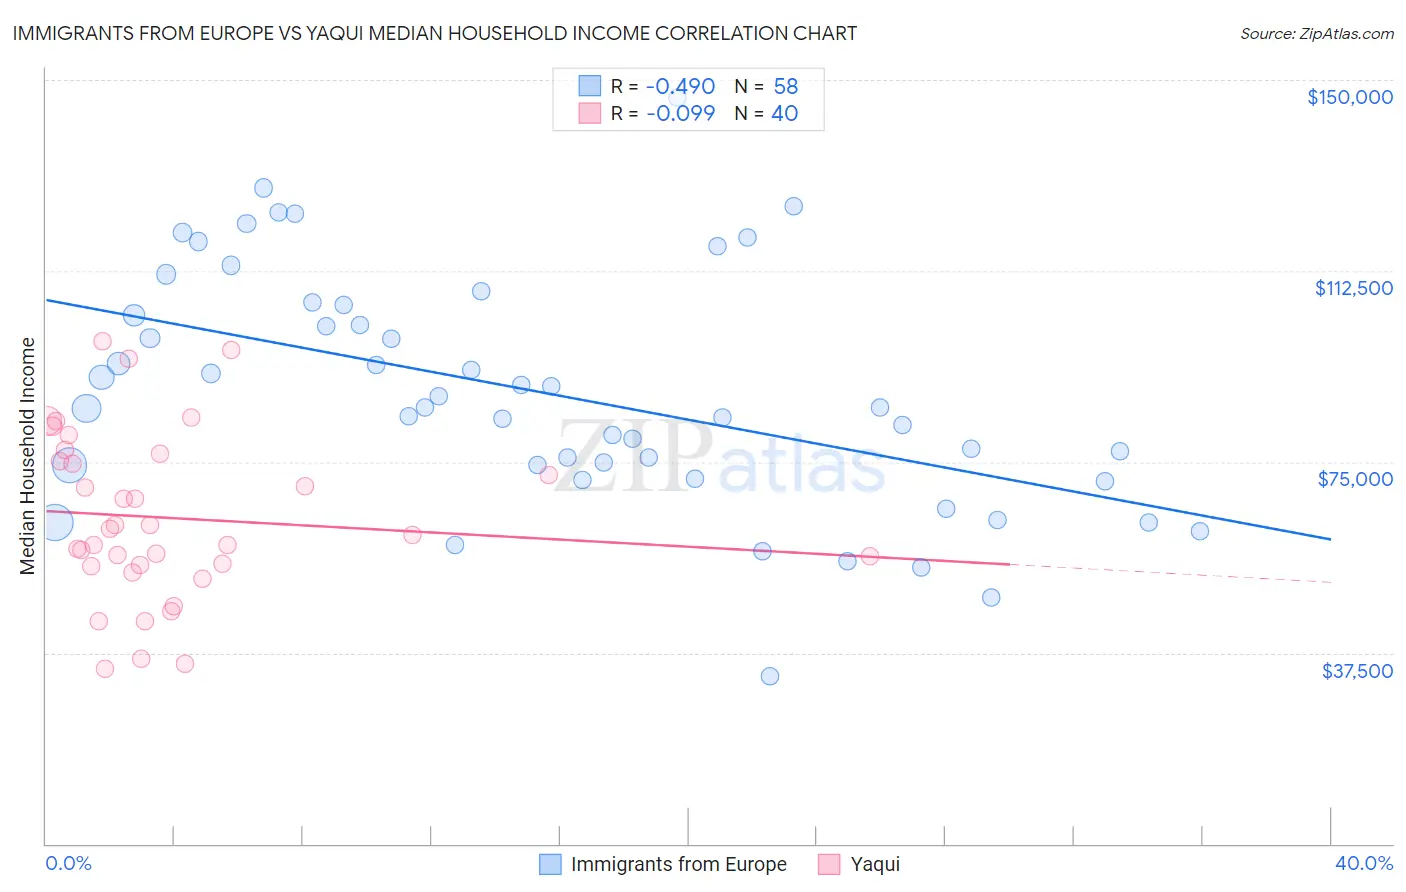
Immigrants from Europe vs Yaqui Median Household Income Correlation Chart
The statistical analysis conducted on geographies consisting of 546,586,899 people shows a moderate negative correlation between the proportion of Immigrants from Europe and median household income in the United States with a correlation coefficient (R) of -0.490 and weighted average of $95,032. Similarly, the statistical analysis conducted on geographies consisting of 107,719,305 people shows a slight negative correlation between the proportion of Yaqui and median household income in the United States with a correlation coefficient (R) of -0.099 and weighted average of $74,596, a difference of 27.4%.
Median Household Income Correlation Summary
| Measurement | Immigrants from Europe | Yaqui |
| Minimum | $32,853 | $34,415 |
| Maximum | $146,675 | $98,754 |
| Range | $113,822 | $64,339 |
| Mean | $88,761 | $64,033 |
| Median | $85,626 | $61,231 |
| Interquartile 25% (IQ1) | $74,349 | $54,573 |
| Interquartile 75% (IQ3) | $105,928 | $75,863 |
| Interquartile Range (IQR) | $31,579 | $21,290 |
| Standard Deviation (Sample) | $23,344 | $16,401 |
| Standard Deviation (Population) | $23,142 | $16,195 |
Similar Demographics by Median Household Income
Demographics Similar to Immigrants from Europe by Median Household Income
In terms of median household income, the demographic groups most similar to Immigrants from Europe are Korean ($95,018, a difference of 0.020%), Laotian ($94,990, a difference of 0.040%), Soviet Union ($95,098, a difference of 0.070%), New Zealander ($95,146, a difference of 0.12%), and Immigrants from Norway ($94,846, a difference of 0.20%).
| Demographics | Rating | Rank | Median Household Income |
| Immigrants | South Africa | 99.9 /100 | #52 | Exceptional $95,800 |
| Paraguayans | 99.9 /100 | #53 | Exceptional $95,737 |
| Egyptians | 99.9 /100 | #54 | Exceptional $95,673 |
| Immigrants | Czechoslovakia | 99.9 /100 | #55 | Exceptional $95,319 |
| Immigrants | Austria | 99.9 /100 | #56 | Exceptional $95,277 |
| New Zealanders | 99.8 /100 | #57 | Exceptional $95,146 |
| Soviet Union | 99.8 /100 | #58 | Exceptional $95,098 |
| Immigrants | Europe | 99.8 /100 | #59 | Exceptional $95,032 |
| Koreans | 99.8 /100 | #60 | Exceptional $95,018 |
| Laotians | 99.8 /100 | #61 | Exceptional $94,990 |
| Immigrants | Norway | 99.8 /100 | #62 | Exceptional $94,846 |
| Greeks | 99.8 /100 | #63 | Exceptional $94,735 |
| Immigrants | Netherlands | 99.7 /100 | #64 | Exceptional $94,411 |
| Immigrants | Belarus | 99.7 /100 | #65 | Exceptional $94,399 |
| Immigrants | Romania | 99.7 /100 | #66 | Exceptional $94,222 |
Demographics Similar to Yaqui by Median Household Income
In terms of median household income, the demographic groups most similar to Yaqui are Cree ($74,685, a difference of 0.12%), Mexican ($74,399, a difference of 0.26%), Central American Indian ($74,847, a difference of 0.34%), Immigrants from Liberia ($74,896, a difference of 0.40%), and Immigrants from Somalia ($74,300, a difference of 0.40%).
| Demographics | Rating | Rank | Median Household Income |
| Spanish Americans | 0.2 /100 | #277 | Tragic $75,386 |
| Osage | 0.2 /100 | #278 | Tragic $75,240 |
| Immigrants | Guatemala | 0.2 /100 | #279 | Tragic $75,123 |
| Senegalese | 0.2 /100 | #280 | Tragic $74,999 |
| Immigrants | Liberia | 0.1 /100 | #281 | Tragic $74,896 |
| Central American Indians | 0.1 /100 | #282 | Tragic $74,847 |
| Cree | 0.1 /100 | #283 | Tragic $74,685 |
| Yaqui | 0.1 /100 | #284 | Tragic $74,596 |
| Mexicans | 0.1 /100 | #285 | Tragic $74,399 |
| Immigrants | Somalia | 0.1 /100 | #286 | Tragic $74,300 |
| Iroquois | 0.1 /100 | #287 | Tragic $74,279 |
| Immigrants | Central America | 0.1 /100 | #288 | Tragic $74,217 |
| Fijians | 0.1 /100 | #289 | Tragic $74,205 |
| Bangladeshis | 0.1 /100 | #290 | Tragic $74,112 |
| Hispanics or Latinos | 0.1 /100 | #291 | Tragic $73,823 |