Immigrants from Thailand vs Scottish Median Earnings
COMPARE
Immigrants from Thailand
Scottish
Median Earnings
Median Earnings Comparison
Immigrants from Thailand
Scottish
$45,598
MEDIAN EARNINGS
23.7/ 100
METRIC RATING
209th/ 347
METRIC RANK
$46,463
MEDIAN EARNINGS
51.1/ 100
METRIC RATING
171st/ 347
METRIC RANK
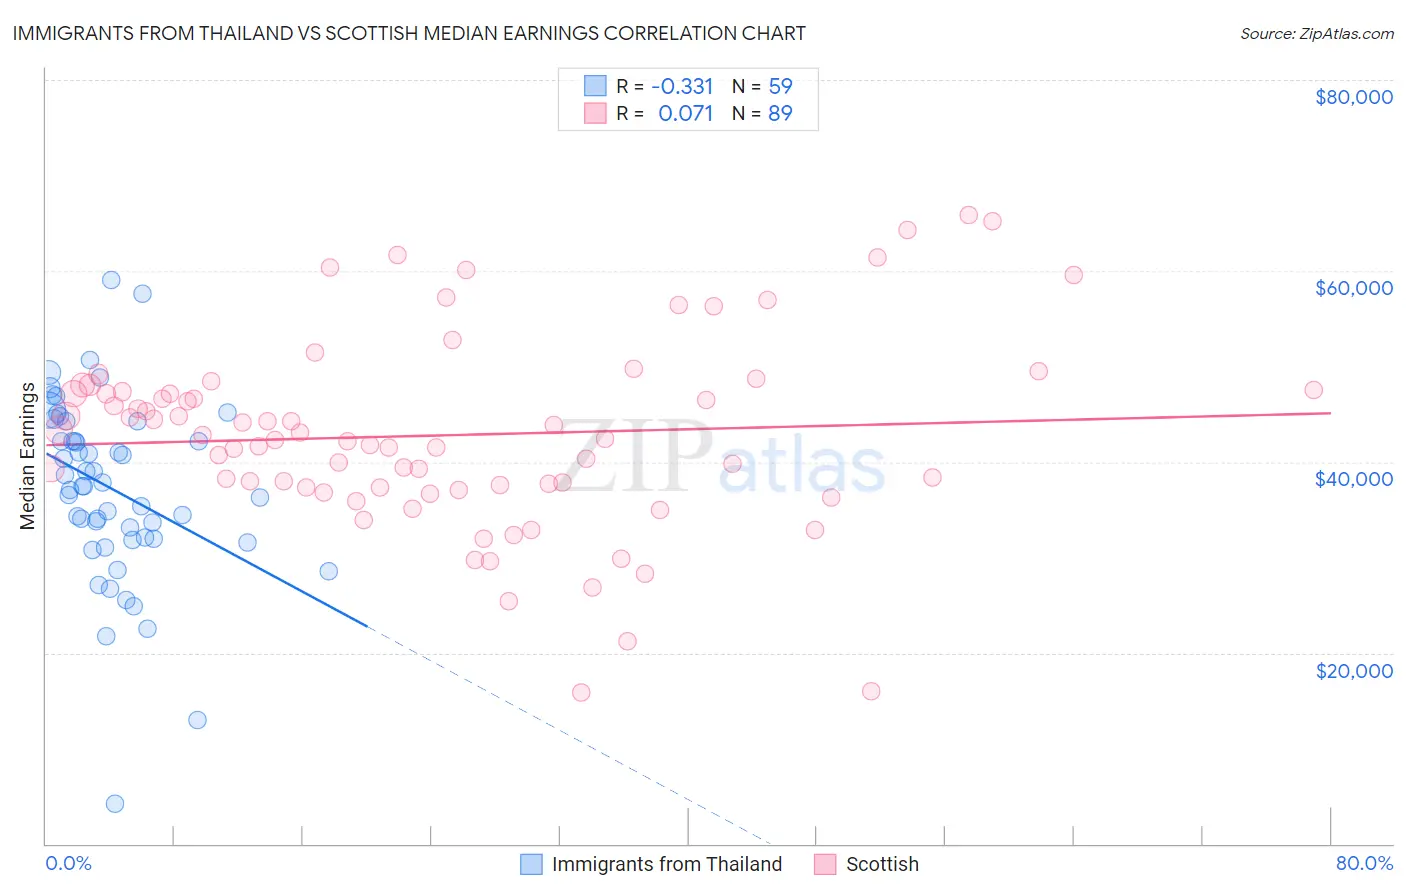
Immigrants from Thailand vs Scottish Median Earnings Correlation Chart
The statistical analysis conducted on geographies consisting of 316,998,923 people shows a mild negative correlation between the proportion of Immigrants from Thailand and median earnings in the United States with a correlation coefficient (R) of -0.331 and weighted average of $45,598. Similarly, the statistical analysis conducted on geographies consisting of 566,727,136 people shows a slight positive correlation between the proportion of Scottish and median earnings in the United States with a correlation coefficient (R) of 0.071 and weighted average of $46,463, a difference of 1.9%.
Median Earnings Correlation Summary
| Measurement | Immigrants from Thailand | Scottish |
| Minimum | $4,250 | $15,833 |
| Maximum | $59,094 | $65,898 |
| Range | $54,844 | $50,065 |
| Mean | $37,184 | $42,786 |
| Median | $37,501 | $42,413 |
| Interquartile 25% (IQ1) | $31,980 | $37,295 |
| Interquartile 75% (IQ3) | $44,250 | $47,447 |
| Interquartile Range (IQR) | $12,270 | $10,152 |
| Standard Deviation (Sample) | $9,579 | $10,003 |
| Standard Deviation (Population) | $9,498 | $9,946 |
Similar Demographics by Median Earnings
Demographics Similar to Immigrants from Thailand by Median Earnings
In terms of median earnings, the demographic groups most similar to Immigrants from Thailand are Immigrants from Bosnia and Herzegovina ($45,600, a difference of 0.0%), Immigrants from Grenada ($45,596, a difference of 0.0%), Panamanian ($45,593, a difference of 0.010%), Bermudan ($45,593, a difference of 0.010%), and Immigrants from Senegal ($45,611, a difference of 0.030%).
| Demographics | Rating | Rank | Median Earnings |
| Immigrants | Trinidad and Tobago | 27.1 /100 | #202 | Fair $45,729 |
| Welsh | 26.6 /100 | #203 | Fair $45,710 |
| Immigrants | Uruguay | 25.9 /100 | #204 | Fair $45,682 |
| Tongans | 25.4 /100 | #205 | Fair $45,665 |
| Immigrants | Ghana | 24.8 /100 | #206 | Fair $45,641 |
| Immigrants | Senegal | 24.0 /100 | #207 | Fair $45,611 |
| Immigrants | Bosnia and Herzegovina | 23.7 /100 | #208 | Fair $45,600 |
| Immigrants | Thailand | 23.7 /100 | #209 | Fair $45,598 |
| Immigrants | Grenada | 23.6 /100 | #210 | Fair $45,596 |
| Panamanians | 23.5 /100 | #211 | Fair $45,593 |
| Bermudans | 23.5 /100 | #212 | Fair $45,593 |
| Immigrants | Colombia | 22.4 /100 | #213 | Fair $45,550 |
| Nigerians | 22.0 /100 | #214 | Fair $45,532 |
| Immigrants | Bangladesh | 22.0 /100 | #215 | Fair $45,532 |
| Guyanese | 20.6 /100 | #216 | Fair $45,470 |
Demographics Similar to Scottish by Median Earnings
In terms of median earnings, the demographic groups most similar to Scottish are Kenyan ($46,462, a difference of 0.0%), Immigrants ($46,478, a difference of 0.030%), Ghanaian ($46,440, a difference of 0.050%), Scandinavian ($46,433, a difference of 0.060%), and Basque ($46,399, a difference of 0.14%).
| Demographics | Rating | Rank | Median Earnings |
| Norwegians | 64.7 /100 | #164 | Good $46,865 |
| South Americans | 62.7 /100 | #165 | Good $46,804 |
| Czechoslovakians | 57.8 /100 | #166 | Average $46,658 |
| Costa Ricans | 57.4 /100 | #167 | Average $46,645 |
| Immigrants | Africa | 54.6 /100 | #168 | Average $46,564 |
| Immigrants | South America | 54.0 /100 | #169 | Average $46,548 |
| Immigrants | Immigrants | 51.6 /100 | #170 | Average $46,478 |
| Scottish | 51.1 /100 | #171 | Average $46,463 |
| Kenyans | 51.0 /100 | #172 | Average $46,462 |
| Ghanaians | 50.3 /100 | #173 | Average $46,440 |
| Scandinavians | 50.0 /100 | #174 | Average $46,433 |
| Basques | 48.8 /100 | #175 | Average $46,399 |
| Danes | 48.6 /100 | #176 | Average $46,392 |
| Belgians | 48.0 /100 | #177 | Average $46,375 |
| Colombians | 47.1 /100 | #178 | Average $46,349 |