Immigrants from Saudi Arabia vs Scottish Median Earnings
COMPARE
Immigrants from Saudi Arabia
Scottish
Median Earnings
Median Earnings Comparison
Immigrants from Saudi Arabia
Scottish
$47,704
MEDIAN EARNINGS
85.6/ 100
METRIC RATING
145th/ 347
METRIC RANK
$46,463
MEDIAN EARNINGS
51.1/ 100
METRIC RATING
171st/ 347
METRIC RANK
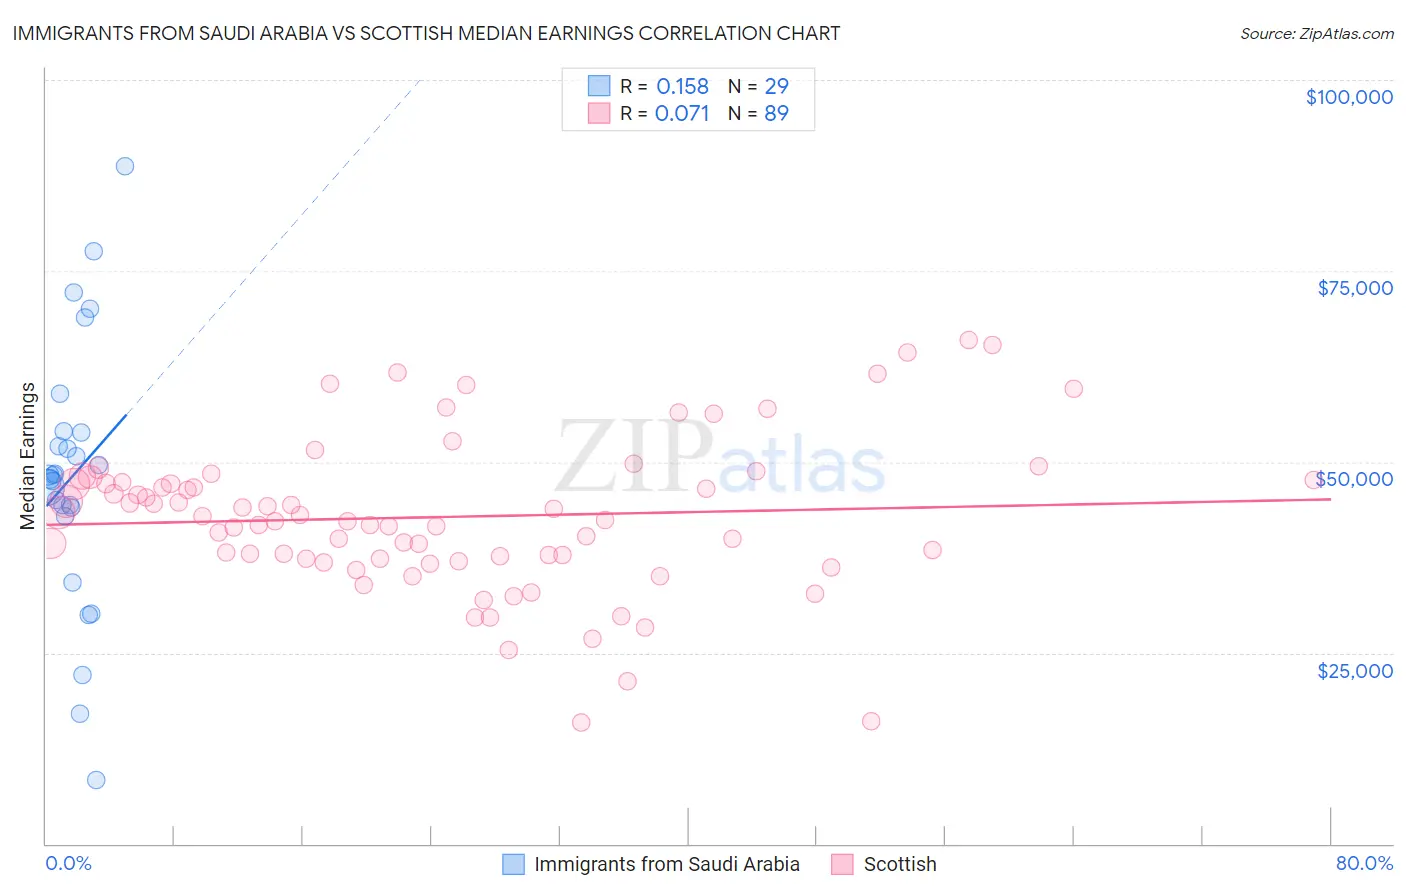
Immigrants from Saudi Arabia vs Scottish Median Earnings Correlation Chart
The statistical analysis conducted on geographies consisting of 164,295,886 people shows a poor positive correlation between the proportion of Immigrants from Saudi Arabia and median earnings in the United States with a correlation coefficient (R) of 0.158 and weighted average of $47,704. Similarly, the statistical analysis conducted on geographies consisting of 566,727,136 people shows a slight positive correlation between the proportion of Scottish and median earnings in the United States with a correlation coefficient (R) of 0.071 and weighted average of $46,463, a difference of 2.7%.
Median Earnings Correlation Summary
| Measurement | Immigrants from Saudi Arabia | Scottish |
| Minimum | $8,283 | $15,833 |
| Maximum | $88,678 | $65,898 |
| Range | $80,395 | $50,065 |
| Mean | $48,188 | $42,786 |
| Median | $48,225 | $42,413 |
| Interquartile 25% (IQ1) | $43,477 | $37,295 |
| Interquartile 75% (IQ3) | $53,983 | $47,447 |
| Interquartile Range (IQR) | $10,507 | $10,152 |
| Standard Deviation (Sample) | $17,307 | $10,003 |
| Standard Deviation (Population) | $17,006 | $9,946 |
Similar Demographics by Median Earnings
Demographics Similar to Immigrants from Saudi Arabia by Median Earnings
In terms of median earnings, the demographic groups most similar to Immigrants from Saudi Arabia are Immigrants from Chile ($47,697, a difference of 0.010%), Immigrants from South Eastern Asia ($47,671, a difference of 0.070%), Immigrants from Eritrea ($47,657, a difference of 0.10%), Luxembourger ($47,640, a difference of 0.14%), and Peruvian ($47,628, a difference of 0.16%).
| Demographics | Rating | Rank | Median Earnings |
| Europeans | 88.9 /100 | #138 | Excellent $47,915 |
| Canadians | 88.8 /100 | #139 | Excellent $47,911 |
| Taiwanese | 88.7 /100 | #140 | Excellent $47,902 |
| Immigrants | Sierra Leone | 88.3 /100 | #141 | Excellent $47,875 |
| Ugandans | 88.0 /100 | #142 | Excellent $47,854 |
| Swedes | 88.0 /100 | #143 | Excellent $47,851 |
| Hungarians | 87.1 /100 | #144 | Excellent $47,795 |
| Immigrants | Saudi Arabia | 85.6 /100 | #145 | Excellent $47,704 |
| Immigrants | Chile | 85.5 /100 | #146 | Excellent $47,697 |
| Immigrants | South Eastern Asia | 85.0 /100 | #147 | Excellent $47,671 |
| Immigrants | Eritrea | 84.8 /100 | #148 | Excellent $47,657 |
| Luxembourgers | 84.5 /100 | #149 | Excellent $47,640 |
| Peruvians | 84.2 /100 | #150 | Excellent $47,628 |
| Immigrants | Oceania | 84.1 /100 | #151 | Excellent $47,617 |
| Immigrants | Germany | 83.1 /100 | #152 | Excellent $47,566 |
Demographics Similar to Scottish by Median Earnings
In terms of median earnings, the demographic groups most similar to Scottish are Kenyan ($46,462, a difference of 0.0%), Immigrants ($46,478, a difference of 0.030%), Ghanaian ($46,440, a difference of 0.050%), Scandinavian ($46,433, a difference of 0.060%), and Basque ($46,399, a difference of 0.14%).
| Demographics | Rating | Rank | Median Earnings |
| Norwegians | 64.7 /100 | #164 | Good $46,865 |
| South Americans | 62.7 /100 | #165 | Good $46,804 |
| Czechoslovakians | 57.8 /100 | #166 | Average $46,658 |
| Costa Ricans | 57.4 /100 | #167 | Average $46,645 |
| Immigrants | Africa | 54.6 /100 | #168 | Average $46,564 |
| Immigrants | South America | 54.0 /100 | #169 | Average $46,548 |
| Immigrants | Immigrants | 51.6 /100 | #170 | Average $46,478 |
| Scottish | 51.1 /100 | #171 | Average $46,463 |
| Kenyans | 51.0 /100 | #172 | Average $46,462 |
| Ghanaians | 50.3 /100 | #173 | Average $46,440 |
| Scandinavians | 50.0 /100 | #174 | Average $46,433 |
| Basques | 48.8 /100 | #175 | Average $46,399 |
| Danes | 48.6 /100 | #176 | Average $46,392 |
| Belgians | 48.0 /100 | #177 | Average $46,375 |
| Colombians | 47.1 /100 | #178 | Average $46,349 |