Kenyan vs Scottish Median Earnings
COMPARE
Kenyan
Scottish
Median Earnings
Median Earnings Comparison
Kenyans
Scottish
$46,462
MEDIAN EARNINGS
51.0/ 100
METRIC RATING
172nd/ 347
METRIC RANK
$46,463
MEDIAN EARNINGS
51.1/ 100
METRIC RATING
171st/ 347
METRIC RANK
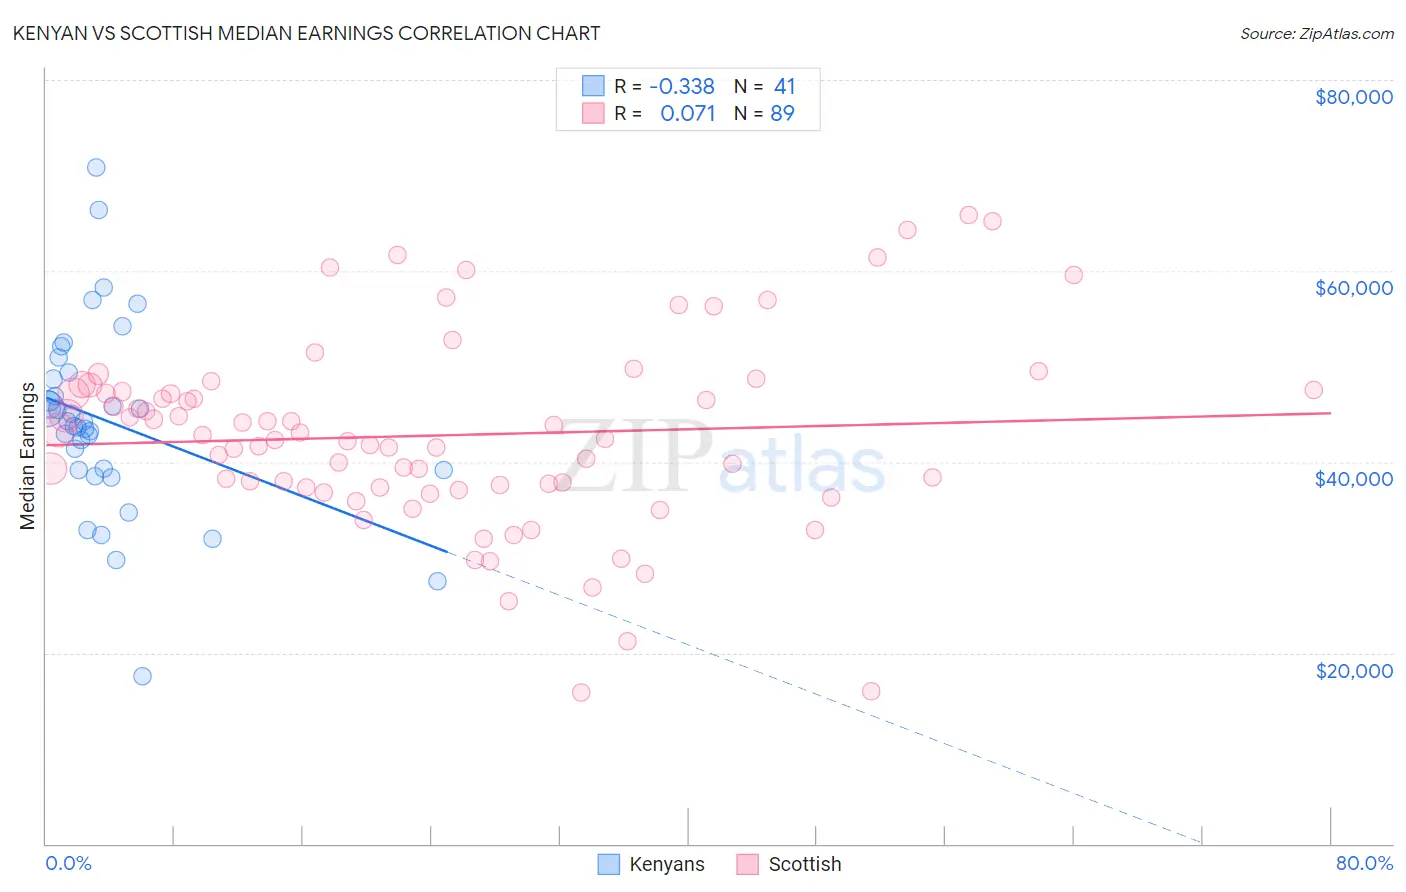
Kenyan vs Scottish Median Earnings Correlation Chart
The statistical analysis conducted on geographies consisting of 168,231,616 people shows a mild negative correlation between the proportion of Kenyans and median earnings in the United States with a correlation coefficient (R) of -0.338 and weighted average of $46,462. Similarly, the statistical analysis conducted on geographies consisting of 566,727,136 people shows a slight positive correlation between the proportion of Scottish and median earnings in the United States with a correlation coefficient (R) of 0.071 and weighted average of $46,463, a difference of 0.0%.
Median Earnings Correlation Summary
| Measurement | Kenyan | Scottish |
| Minimum | $17,500 | $15,833 |
| Maximum | $70,848 | $65,898 |
| Range | $53,348 | $50,065 |
| Mean | $44,292 | $42,786 |
| Median | $44,246 | $42,413 |
| Interquartile 25% (IQ1) | $39,165 | $37,295 |
| Interquartile 75% (IQ3) | $49,031 | $47,447 |
| Interquartile Range (IQR) | $9,866 | $10,152 |
| Standard Deviation (Sample) | $9,917 | $10,003 |
| Standard Deviation (Population) | $9,795 | $9,946 |
Demographics Similar to Kenyans and Scottish by Median Earnings
In terms of median earnings, the demographic groups most similar to Kenyans are Immigrants ($46,478, a difference of 0.030%), Ghanaian ($46,440, a difference of 0.050%), Scandinavian ($46,433, a difference of 0.060%), Basque ($46,399, a difference of 0.14%), and Danish ($46,392, a difference of 0.15%). Similarly, the demographic groups most similar to Scottish are Immigrants ($46,478, a difference of 0.030%), Ghanaian ($46,440, a difference of 0.050%), Scandinavian ($46,433, a difference of 0.060%), Basque ($46,399, a difference of 0.14%), and Danish ($46,392, a difference of 0.15%).
| Demographics | Rating | Rank | Median Earnings |
| Immigrants | Eastern Africa | 68.0 /100 | #161 | Good $46,969 |
| South American Indians | 67.4 /100 | #162 | Good $46,952 |
| Icelanders | 66.3 /100 | #163 | Good $46,916 |
| Norwegians | 64.7 /100 | #164 | Good $46,865 |
| South Americans | 62.7 /100 | #165 | Good $46,804 |
| Czechoslovakians | 57.8 /100 | #166 | Average $46,658 |
| Costa Ricans | 57.4 /100 | #167 | Average $46,645 |
| Immigrants | Africa | 54.6 /100 | #168 | Average $46,564 |
| Immigrants | South America | 54.0 /100 | #169 | Average $46,548 |
| Immigrants | Immigrants | 51.6 /100 | #170 | Average $46,478 |
| Scottish | 51.1 /100 | #171 | Average $46,463 |
| Kenyans | 51.0 /100 | #172 | Average $46,462 |
| Ghanaians | 50.3 /100 | #173 | Average $46,440 |
| Scandinavians | 50.0 /100 | #174 | Average $46,433 |
| Basques | 48.8 /100 | #175 | Average $46,399 |
| Danes | 48.6 /100 | #176 | Average $46,392 |
| Belgians | 48.0 /100 | #177 | Average $46,375 |
| Colombians | 47.1 /100 | #178 | Average $46,349 |
| English | 46.5 /100 | #179 | Average $46,334 |
| Puget Sound Salish | 46.5 /100 | #180 | Average $46,333 |
| Immigrants | Cameroon | 46.4 /100 | #181 | Average $46,329 |