Immigrants from Eritrea vs Korean Median Female Earnings
COMPARE
Immigrants from Eritrea
Korean
Median Female Earnings
Median Female Earnings Comparison
Immigrants from Eritrea
Koreans
$41,485
MEDIAN FEMALE EARNINGS
97.6/ 100
METRIC RATING
106th/ 347
METRIC RANK
$41,276
MEDIAN FEMALE EARNINGS
96.4/ 100
METRIC RATING
115th/ 347
METRIC RANK
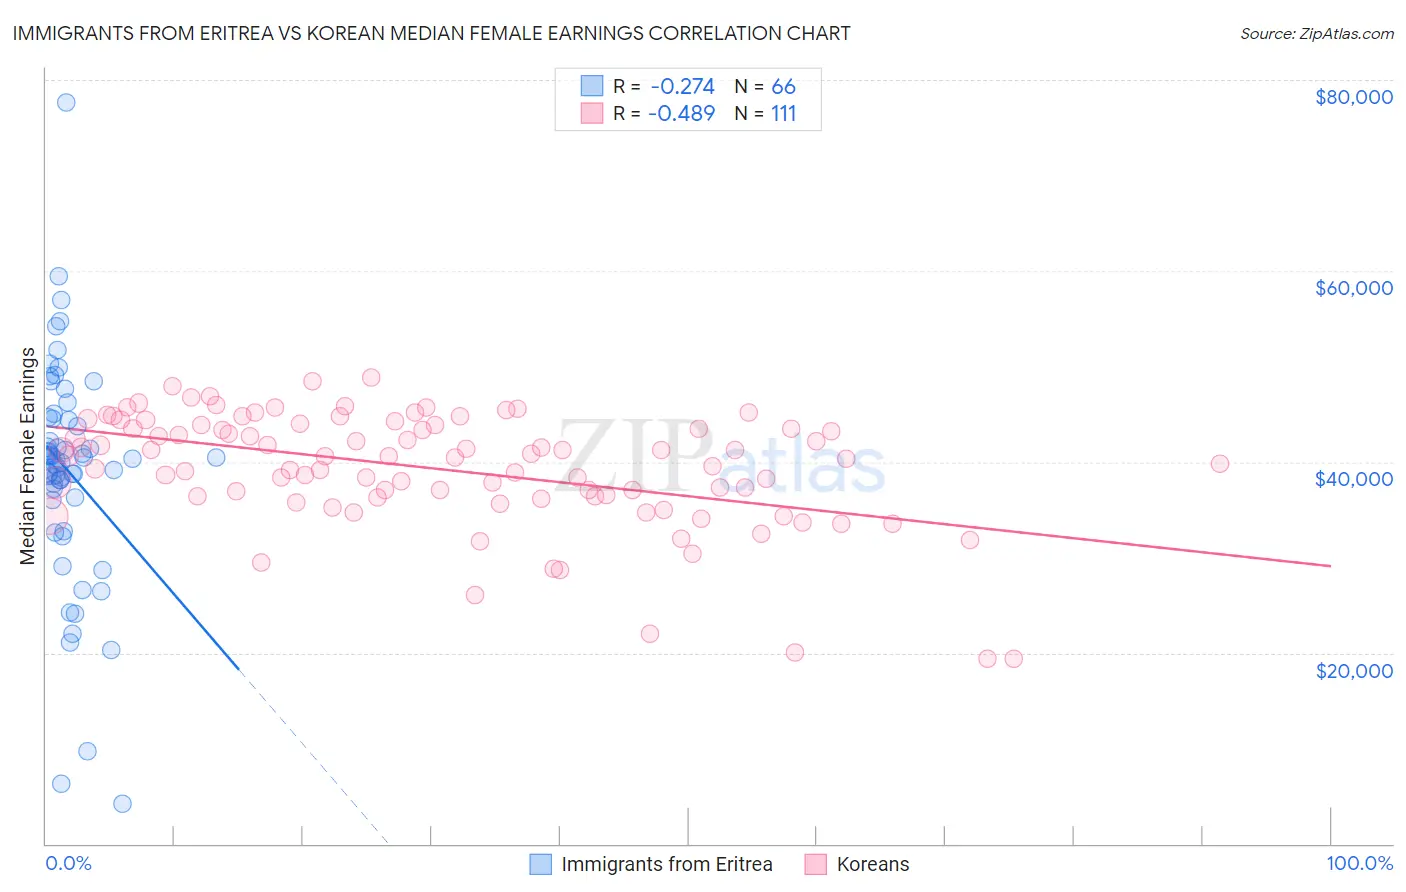
Immigrants from Eritrea vs Korean Median Female Earnings Correlation Chart
The statistical analysis conducted on geographies consisting of 104,836,938 people shows a weak negative correlation between the proportion of Immigrants from Eritrea and median female earnings in the United States with a correlation coefficient (R) of -0.274 and weighted average of $41,485. Similarly, the statistical analysis conducted on geographies consisting of 510,529,365 people shows a moderate negative correlation between the proportion of Koreans and median female earnings in the United States with a correlation coefficient (R) of -0.489 and weighted average of $41,276, a difference of 0.51%.
Median Female Earnings Correlation Summary
| Measurement | Immigrants from Eritrea | Korean |
| Minimum | $4,132 | $19,330 |
| Maximum | $77,694 | $48,873 |
| Range | $73,562 | $29,543 |
| Mean | $38,981 | $39,268 |
| Median | $40,245 | $40,570 |
| Interquartile 25% (IQ1) | $36,285 | $36,354 |
| Interquartile 75% (IQ3) | $44,525 | $43,801 |
| Interquartile Range (IQR) | $8,239 | $7,447 |
| Standard Deviation (Sample) | $11,801 | $6,022 |
| Standard Deviation (Population) | $11,712 | $5,995 |
Demographics Similar to Immigrants from Eritrea and Koreans by Median Female Earnings
In terms of median female earnings, the demographic groups most similar to Immigrants from Eritrea are Palestinian ($41,484, a difference of 0.0%), Italian ($41,505, a difference of 0.050%), Jordanian ($41,464, a difference of 0.050%), Chinese ($41,461, a difference of 0.060%), and Immigrants from Zimbabwe ($41,527, a difference of 0.10%). Similarly, the demographic groups most similar to Koreans are Immigrants from England ($41,277, a difference of 0.0%), Immigrants from Brazil ($41,273, a difference of 0.010%), Macedonian ($41,286, a difference of 0.020%), Barbadian ($41,261, a difference of 0.040%), and Immigrants from North America ($41,319, a difference of 0.10%).
| Demographics | Rating | Rank | Median Female Earnings |
| Romanians | 98.3 /100 | #100 | Exceptional $41,663 |
| Immigrants | Fiji | 98.3 /100 | #101 | Exceptional $41,656 |
| Immigrants | Poland | 98.2 /100 | #102 | Exceptional $41,630 |
| Immigrants | Argentina | 97.9 /100 | #103 | Exceptional $41,554 |
| Immigrants | Zimbabwe | 97.8 /100 | #104 | Exceptional $41,527 |
| Italians | 97.7 /100 | #105 | Exceptional $41,505 |
| Immigrants | Eritrea | 97.6 /100 | #106 | Exceptional $41,485 |
| Palestinians | 97.6 /100 | #107 | Exceptional $41,484 |
| Jordanians | 97.5 /100 | #108 | Exceptional $41,464 |
| Chinese | 97.5 /100 | #109 | Exceptional $41,461 |
| Immigrants | Western Asia | 97.0 /100 | #110 | Exceptional $41,375 |
| Immigrants | Canada | 97.0 /100 | #111 | Exceptional $41,373 |
| Immigrants | North America | 96.7 /100 | #112 | Exceptional $41,319 |
| Macedonians | 96.4 /100 | #113 | Exceptional $41,286 |
| Immigrants | England | 96.4 /100 | #114 | Exceptional $41,277 |
| Koreans | 96.4 /100 | #115 | Exceptional $41,276 |
| Immigrants | Brazil | 96.4 /100 | #116 | Exceptional $41,273 |
| Barbadians | 96.3 /100 | #117 | Exceptional $41,261 |
| Immigrants | Lebanon | 95.6 /100 | #118 | Exceptional $41,183 |
| Immigrants | Philippines | 95.0 /100 | #119 | Exceptional $41,114 |
| Immigrants | Kuwait | 94.4 /100 | #120 | Exceptional $41,055 |