Immigrants from Eritrea vs Immigrants from Argentina Unemployment Among Ages 45 to 54 years
COMPARE
Immigrants from Eritrea
Immigrants from Argentina
Unemployment Among Ages 45 to 54 years
Unemployment Among Ages 45 to 54 years Comparison
Immigrants from Eritrea
Immigrants from Argentina
4.4%
UNEMPLOYMENT AMONG AGES 45 TO 54 YEARS
94.7/ 100
METRIC RATING
100th/ 347
METRIC RANK
4.3%
UNEMPLOYMENT AMONG AGES 45 TO 54 YEARS
96.9/ 100
METRIC RATING
89th/ 347
METRIC RANK
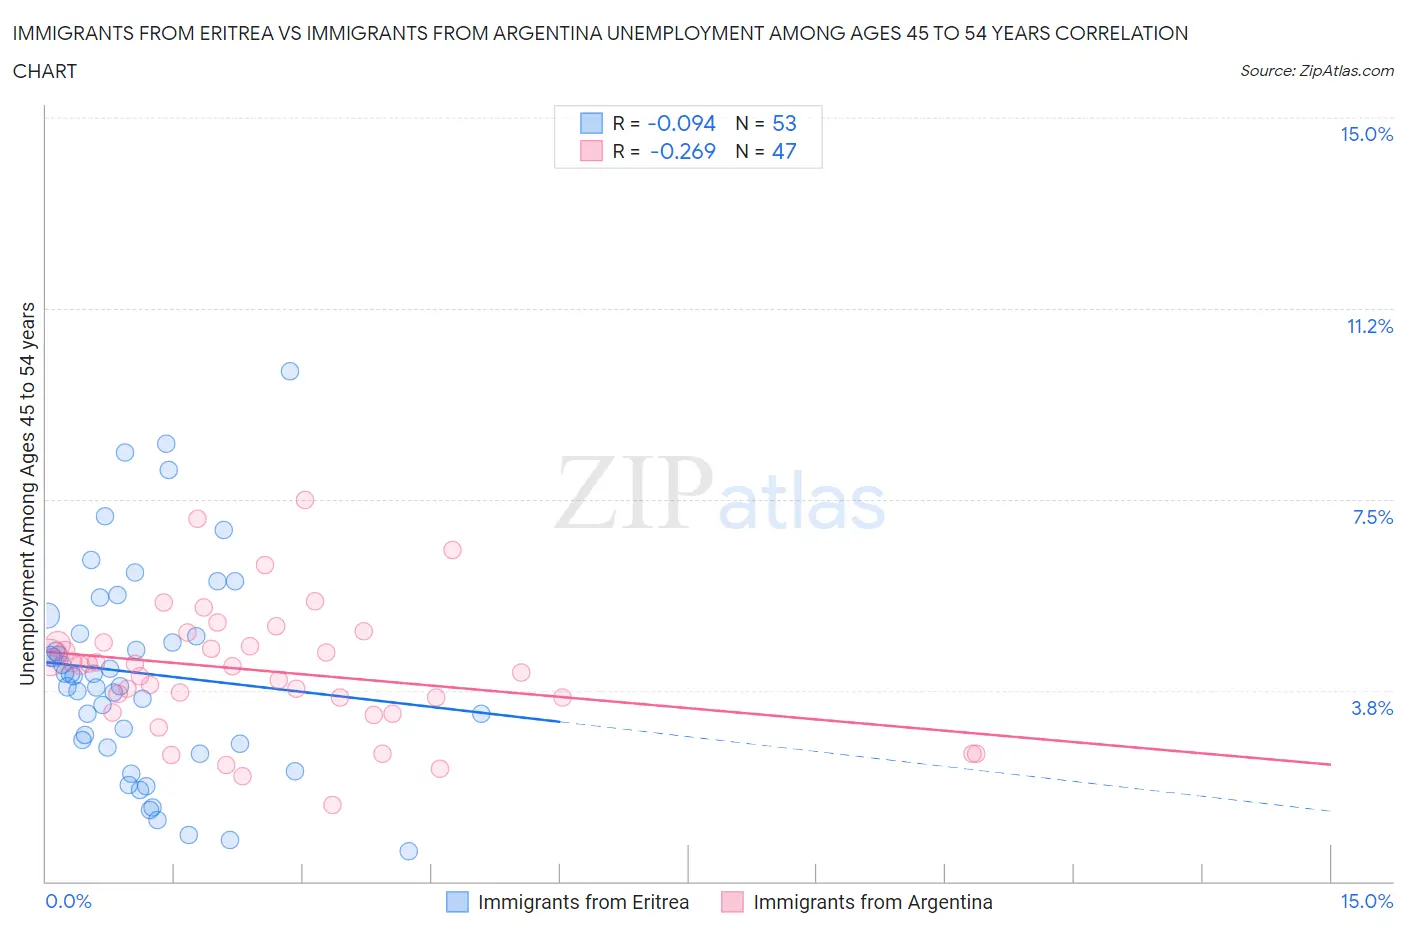
Immigrants from Eritrea vs Immigrants from Argentina Unemployment Among Ages 45 to 54 years Correlation Chart
The statistical analysis conducted on geographies consisting of 104,558,577 people shows a slight negative correlation between the proportion of Immigrants from Eritrea and unemployment rate among population between the ages 45 and 54 in the United States with a correlation coefficient (R) of -0.094 and weighted average of 4.4%. Similarly, the statistical analysis conducted on geographies consisting of 261,592,376 people shows a weak negative correlation between the proportion of Immigrants from Argentina and unemployment rate among population between the ages 45 and 54 in the United States with a correlation coefficient (R) of -0.269 and weighted average of 4.3%, a difference of 0.69%.
Unemployment Among Ages 45 to 54 years Correlation Summary
| Measurement | Immigrants from Eritrea | Immigrants from Argentina |
| Minimum | 0.60% | 1.5% |
| Maximum | 10.0% | 7.5% |
| Range | 9.4% | 6.0% |
| Mean | 4.1% | 4.1% |
| Median | 4.0% | 4.2% |
| Interquartile 25% (IQ1) | 2.7% | 3.3% |
| Interquartile 75% (IQ3) | 5.0% | 4.7% |
| Interquartile Range (IQR) | 2.4% | 1.4% |
| Standard Deviation (Sample) | 2.1% | 1.3% |
| Standard Deviation (Population) | 2.1% | 1.3% |
Demographics Similar to Immigrants from Eritrea and Immigrants from Argentina by Unemployment Among Ages 45 to 54 years
In terms of unemployment among ages 45 to 54 years, the demographic groups most similar to Immigrants from Eritrea are Immigrants from Burma/Myanmar (4.4%, a difference of 0.030%), Romanian (4.4%, a difference of 0.050%), Immigrants from Canada (4.4%, a difference of 0.060%), Indonesian (4.4%, a difference of 0.18%), and Immigrants from North America (4.4%, a difference of 0.19%). Similarly, the demographic groups most similar to Immigrants from Argentina are Immigrants from Turkey (4.3%, a difference of 0.0%), Sudanese (4.3%, a difference of 0.040%), Asian (4.3%, a difference of 0.050%), Ukrainian (4.3%, a difference of 0.12%), and Ethiopian (4.3%, a difference of 0.13%).
| Demographics | Rating | Rank | Unemployment Among Ages 45 to 54 years |
| Italians | 97.3 /100 | #84 | Exceptional 4.3% |
| French | 97.3 /100 | #85 | Exceptional 4.3% |
| Ethiopians | 97.2 /100 | #86 | Exceptional 4.3% |
| Sudanese | 97.0 /100 | #87 | Exceptional 4.3% |
| Immigrants | Turkey | 96.9 /100 | #88 | Exceptional 4.3% |
| Immigrants | Argentina | 96.9 /100 | #89 | Exceptional 4.3% |
| Asians | 96.8 /100 | #90 | Exceptional 4.3% |
| Ukrainians | 96.6 /100 | #91 | Exceptional 4.3% |
| Mongolians | 96.6 /100 | #92 | Exceptional 4.3% |
| Argentineans | 96.5 /100 | #93 | Exceptional 4.3% |
| Immigrants | Malaysia | 96.2 /100 | #94 | Exceptional 4.4% |
| Immigrants | Ethiopia | 96.1 /100 | #95 | Exceptional 4.4% |
| Indonesians | 95.4 /100 | #96 | Exceptional 4.4% |
| Immigrants | Canada | 95.0 /100 | #97 | Exceptional 4.4% |
| Romanians | 94.9 /100 | #98 | Exceptional 4.4% |
| Immigrants | Burma/Myanmar | 94.9 /100 | #99 | Exceptional 4.4% |
| Immigrants | Eritrea | 94.7 /100 | #100 | Exceptional 4.4% |
| Immigrants | North America | 93.9 /100 | #101 | Exceptional 4.4% |
| Sri Lankans | 93.7 /100 | #102 | Exceptional 4.4% |
| Icelanders | 93.5 /100 | #103 | Exceptional 4.4% |
| Immigrants | Sweden | 93.0 /100 | #104 | Exceptional 4.4% |