Immigrants from Ecuador vs Immigrants from Central America Householder Income Under 25 years

COMPARE

Immigrants from Ecuador
Race
Ancestry
AfghanAfricanAlaska NativeAlaskan AthabascanAlbanianAleutAlsatianAmericanApacheArabArapahoArgentineanArmenianAssyrian/Chaldean/SyriacAustralianAustrianBahamianBangladeshiBarbadianBasqueBelgianBelizeanBermudanBhutaneseBlackfeetBolivianBrazilianBritishBritish West IndianBulgarianBurmeseCajunCambodianCanadianCape VerdeanCarpatho RusynCelticCentral AmericanCentral American IndianCherokeeCheyenneChickasawChileanChineseChippewaChoctawColombianColvilleComancheCosta RicanCreeCreekCroatianCrowCubanCypriotCzechCzechoslovakianDanishDelawareDominicanDutchDutch West IndianEastern EuropeanEcuadorianEgyptianEnglishEstonianEthiopianEuropeanFijianFilipinoFinnishFrenchFrench American IndianFrench CanadianGermanGerman RussianGhanaianGreekGuamanian/ChamorroGuatemalanGuyaneseHaitianHmongHonduranHopiHoumaHungarianIcelanderIndian (Asian)IndonesianInupiatIranianIraqiIrishIroquoisIsraeliItalianJamaicanJapaneseJordanianKenyanKiowaKoreanLaotianLatvianLebaneseLiberianLithuanianLumbeeLuxembourgerMacedonianMalaysianMalteseMarshalleseMenomineeMexicanMexican American IndianMongolianMoroccanNative HawaiianNavajoNepaleseNew ZealanderNicaraguanNigerianNorthern EuropeanNorwegianOkinawanOsageOttawaPaiutePakistaniPalestinianPanamanianParaguayanPennsylvania GermanPeruvianPimaPolishPortuguesePotawatomiPuebloPuerto RicanPuget Sound SalishRomanianRussianSalvadoranSamoanScandinavianScotch-IrishScottishSeminoleSenegaleseSerbianShoshoneSierra LeoneanSiouxSlavicSlovakSloveneSomaliSouth AfricanSouth AmericanSouth American IndianSoviet UnionSpaniardSpanishSpanish AmericanSpanish American IndianSri LankanSubsaharan AfricanSudaneseSwedishSwissSyrianTaiwaneseThaiTlingit-HaidaTohono O'OdhamTonganTrinidadian and TobagonianTsimshianTurkishU.S. Virgin IslanderUgandanUkrainianUruguayanUteVenezuelanVietnameseWelshWest IndianYakamaYaquiYugoslavianYumanYup'ikZimbabwean
Immigration
NonimmigrantsImmigrantsAfghanistanAfricaAlbaniaArgentinaArmeniaAsiaAustraliaAustriaBahamasBangladeshBarbadosBelarusBelgiumBelizeBoliviaBosnia and HerzegovinaBrazilBulgariaBurma/MyanmarCabo VerdeCambodiaCameroonCanadaCaribbeanChileChinaColombiaCongoCosta RicaCroatiaCubaCzechoslovakiaDenmarkDominicaDominican RepublicEastern AfricaEastern AsiaEastern EuropeEcuadorEgyptEl SalvadorEnglandEritreaEthiopiaEuropeFijiFranceGermanyGhanaGreeceGrenadaGuatemalaGuyanaHaitiHondurasHong KongHungaryIndiaIndonesiaIranIraqIrelandIsraelItalyJamaicaJapanJordanKazakhstanKenyaKoreaKuwaitLaosLatin AmericaLatviaLebanonLiberiaLithuaniaMalaysiaMexicoMicronesiaMiddle AfricaMoldovaMoroccoNepalNetherlandsNicaraguaNigeriaNorth AmericaNorth MacedoniaNorthern AfricaNorthern EuropeNorwayOceaniaPakistanPanamaPeruPhilippinesPolandPortugalRomaniaRussiaSaudi ArabiaScotlandSenegalSerbiaSierra LeoneSingaporeSomaliaSouth AfricaSouth AmericaSouth Central AsiaSouth Eastern AsiaSouthern EuropeSpainSri LankaSt. Vincent and the GrenadinesSudanSwedenSwitzerlandSyriaTaiwanThailandTrinidad and TobagoTurkeyUgandaUkraineUruguayUzbekistanVenezuelaVietnamWest IndiesWestern AfricaWestern AsiaWestern EuropeYemenZaireZimbabweAzores
Immigrants from Central America
Race
Ancestry
AfghanAfricanAlaska NativeAlaskan AthabascanAlbanianAleutAlsatianAmericanApacheArabArapahoArgentineanArmenianAssyrian/Chaldean/SyriacAustralianAustrianBahamianBangladeshiBarbadianBasqueBelgianBelizeanBermudanBhutaneseBlackfeetBolivianBrazilianBritishBritish West IndianBulgarianBurmeseCajunCambodianCanadianCape VerdeanCarpatho RusynCelticCentral AmericanCentral American IndianCherokeeCheyenneChickasawChileanChineseChippewaChoctawColombianColvilleComancheCosta RicanCreeCreekCroatianCrowCubanCypriotCzechCzechoslovakianDanishDelawareDominicanDutchDutch West IndianEastern EuropeanEcuadorianEgyptianEnglishEstonianEthiopianEuropeanFijianFilipinoFinnishFrenchFrench American IndianFrench CanadianGermanGerman RussianGhanaianGreekGuamanian/ChamorroGuatemalanGuyaneseHaitianHmongHonduranHopiHoumaHungarianIcelanderIndian (Asian)IndonesianInupiatIranianIraqiIrishIroquoisIsraeliItalianJamaicanJapaneseJordanianKenyanKiowaKoreanLaotianLatvianLebaneseLiberianLithuanianLumbeeLuxembourgerMacedonianMalaysianMalteseMarshalleseMenomineeMexicanMexican American IndianMongolianMoroccanNative HawaiianNavajoNepaleseNew ZealanderNicaraguanNigerianNorthern EuropeanNorwegianOkinawanOsageOttawaPaiutePakistaniPalestinianPanamanianParaguayanPennsylvania GermanPeruvianPimaPolishPortuguesePotawatomiPuebloPuerto RicanPuget Sound SalishRomanianRussianSalvadoranSamoanScandinavianScotch-IrishScottishSeminoleSenegaleseSerbianShoshoneSierra LeoneanSiouxSlavicSlovakSloveneSomaliSouth AfricanSouth AmericanSouth American IndianSoviet UnionSpaniardSpanishSpanish AmericanSpanish American IndianSri LankanSubsaharan AfricanSudaneseSwedishSwissSyrianTaiwaneseThaiTlingit-HaidaTohono O'OdhamTonganTrinidadian and TobagonianTsimshianTurkishU.S. Virgin IslanderUgandanUkrainianUruguayanUteVenezuelanVietnameseWelshWest IndianYakamaYaquiYugoslavianYumanYup'ikZimbabwean
Immigration
NonimmigrantsImmigrantsAfghanistanAfricaAlbaniaArgentinaArmeniaAsiaAustraliaAustriaBahamasBangladeshBarbadosBelarusBelgiumBelizeBoliviaBosnia and HerzegovinaBrazilBulgariaBurma/MyanmarCabo VerdeCambodiaCameroonCanadaCaribbeanCentral AmericaChileChinaColombiaCongoCosta RicaCroatiaCubaCzechoslovakiaDenmarkDominicaDominican RepublicEastern AfricaEastern AsiaEastern EuropeEgyptEl SalvadorEnglandEritreaEthiopiaEuropeFijiFranceGermanyGhanaGreeceGrenadaGuatemalaGuyanaHaitiHondurasHong KongHungaryIndiaIndonesiaIranIraqIrelandIsraelItalyJamaicaJapanJordanKazakhstanKenyaKoreaKuwaitLaosLatin AmericaLatviaLebanonLiberiaLithuaniaMalaysiaMexicoMicronesiaMiddle AfricaMoldovaMoroccoNepalNetherlandsNicaraguaNigeriaNorth AmericaNorth MacedoniaNorthern AfricaNorthern EuropeNorwayOceaniaPakistanPanamaPeruPhilippinesPolandPortugalRomaniaRussiaSaudi ArabiaScotlandSenegalSerbiaSierra LeoneSingaporeSomaliaSouth AfricaSouth AmericaSouth Central AsiaSouth Eastern AsiaSouthern EuropeSpainSri LankaSt. Vincent and the GrenadinesSudanSwedenSwitzerlandSyriaTaiwanThailandTrinidad and TobagoTurkeyUgandaUkraineUruguayUzbekistanVenezuelaVietnamWest IndiesWestern AfricaWestern AsiaWestern EuropeYemenZaireZimbabweAzores
Householder Income Under 25 years
Income
Poverty
Unemployment
Labor Participation
Family Structure
Vehicle Availability
Education Level
Disability

Householder Income Under 25 years Comparison

Immigrants from Ecuador

Immigrants from Central America

Exceptional
Tragic
$53,722
HOUSEHOLDER INCOME UNDER 25 YEARS
97.7/ 100
METRIC RATING
109th/ 347
METRIC RANK
$51,022
HOUSEHOLDER INCOME UNDER 25 YEARS
5.4/ 100
METRIC RATING
227th/ 347
METRIC RANK

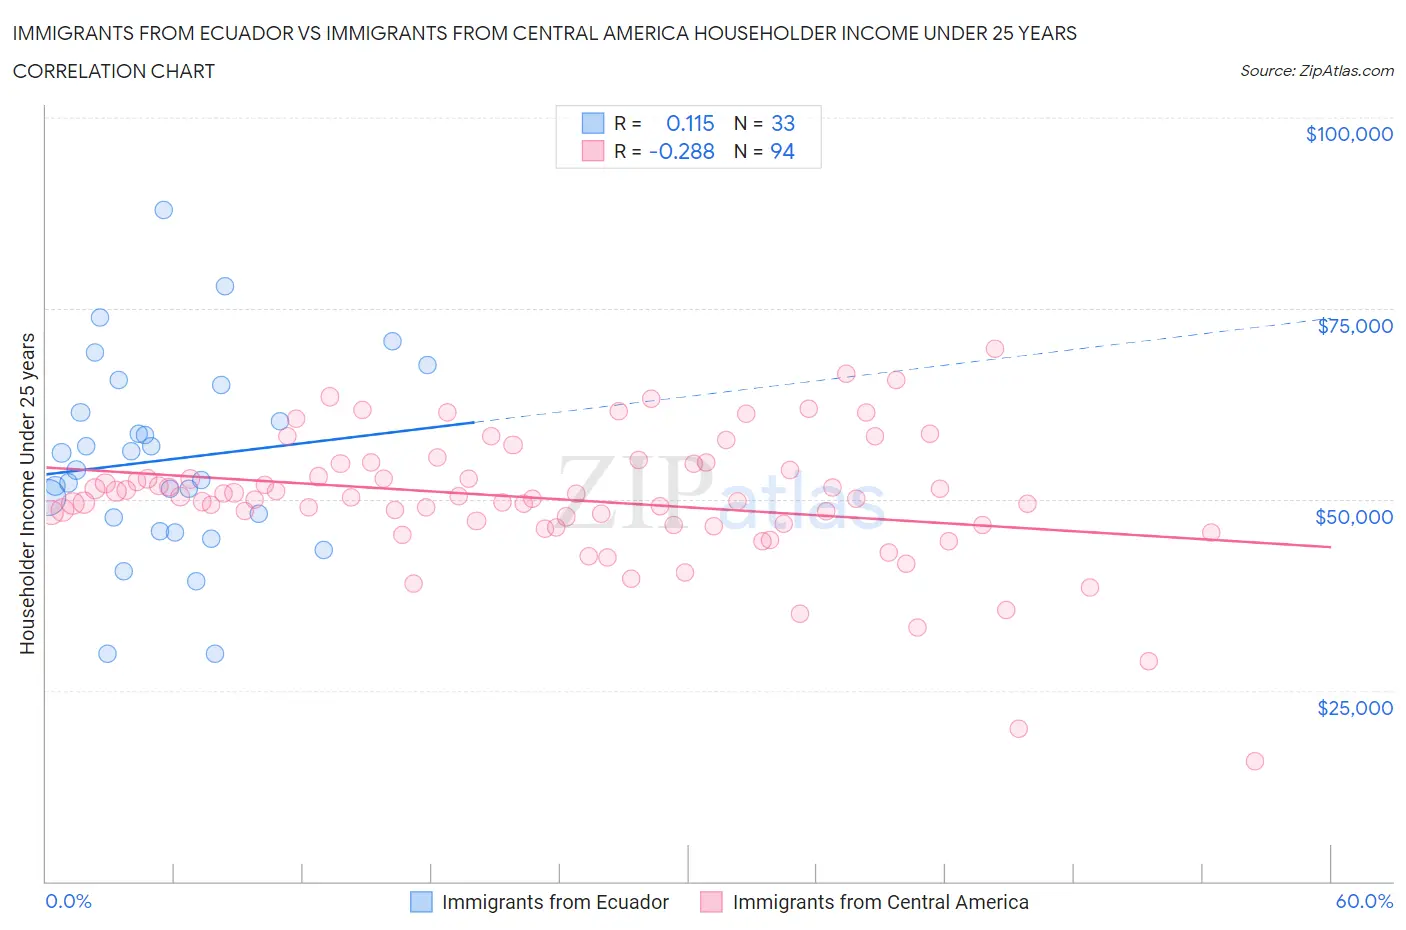
Immigrants from Ecuador vs Immigrants from Central America Householder Income Under 25 years Correlation Chart

The statistical analysis conducted on geographies consisting of 234,245,730 people shows a poor positive correlation between the proportion of Immigrants from Ecuador and household income with householder under the age of 25 in the United States with a correlation coefficient (R) of 0.115 and weighted average of $53,722. Similarly, the statistical analysis conducted on geographies consisting of 425,295,925 people shows a weak negative correlation between the proportion of Immigrants from Central America and household income with householder under the age of 25 in the United States with a correlation coefficient (R) of -0.288 and weighted average of $51,022, a difference of 5.3%.
Immigrants from Ecuador vs Immigrants from Central America Householder Income Under 25 years

Householder Income Under 25 years Correlation Summary

MeasurementImmigrants from EcuadorImmigrants from Central America
Minimum$29,733$15,750
Maximum$87,926$69,727
Range$58,193$53,977
Mean$55,187$50,026
Median$53,782$50,176
Interquartile 25% (IQ1)$46,779$46,703
Interquartile 75% (IQ3)$63,173$54,624
Interquartile Range (IQR)$16,394$7,920
Standard Deviation (Sample)$12,746$8,635
Standard Deviation (Population)$12,552$8,589

Similar Demographics by Householder Income Under 25 years

Demographics Similar to Immigrants from Ecuador by Householder Income Under 25 years

In terms of householder income under 25 years, the demographic groups most similar to Immigrants from Ecuador are Greek ($53,715, a difference of 0.010%), Immigrants from Colombia ($53,714, a difference of 0.010%), Maltese ($53,735, a difference of 0.020%), Australian ($53,739, a difference of 0.030%), and Immigrants from Oceania ($53,680, a difference of 0.080%).
DemographicsRating | RankHouseholder Income Under 25 years
Ecuadorians
98.5
/100
|
#102
Exceptional
$53,911
Ukrainians
98.3
/100
|
#103
Exceptional
$53,843
Ethiopians
98.2
/100
|
#104
Exceptional
$53,818
Immigrants | France
98.1
/100
|
#105
Exceptional
$53,805
Albanians
98.1
/100
|
#106
Exceptional
$53,794
Australians
97.8
/100
|
#107
Exceptional
$53,739
Maltese
97.8
/100
|
#108
Exceptional
$53,735
Immigrants | Ecuador
97.7
/100
|
#109
Exceptional
$53,722
Greeks
97.7
/100
|
#110
Exceptional
$53,715
Immigrants | Colombia
97.7
/100
|
#111
Exceptional
$53,714
Immigrants | Oceania
97.5
/100
|
#112
Exceptional
$53,680
Romanians
97.2
/100
|
#113
Exceptional
$53,632
Immigrants | Sweden
97.1
/100
|
#114
Exceptional
$53,621
Immigrants | Albania
96.9
/100
|
#115
Exceptional
$53,597
Immigrants | Spain
96.6
/100
|
#116
Exceptional
$53,560

Demographics Similar to Immigrants from Central America by Householder Income Under 25 years

In terms of householder income under 25 years, the demographic groups most similar to Immigrants from Central America are Yugoslavian ($51,028, a difference of 0.010%), Immigrants from Jamaica ($51,038, a difference of 0.030%), Immigrants from Norway ($50,984, a difference of 0.070%), Belizean ($51,094, a difference of 0.14%), and Serbian ($51,106, a difference of 0.16%).
DemographicsRating | RankHouseholder Income Under 25 years
Immigrants | Germany
8.0
/100
|
#220
Tragic
$51,190
Immigrants | Eastern Africa
7.4
/100
|
#221
Tragic
$51,158
Spaniards
6.8
/100
|
#222
Tragic
$51,117
Serbians
6.6
/100
|
#223
Tragic
$51,106
Belizeans
6.4
/100
|
#224
Tragic
$51,094
Immigrants | Jamaica
5.6
/100
|
#225
Tragic
$51,038
Yugoslavians
5.5
/100
|
#226
Tragic
$51,028
Immigrants | Central America
5.4
/100
|
#227
Tragic
$51,022
Immigrants | Norway
5.0
/100
|
#228
Tragic
$50,984
Yuman
4.4
/100
|
#229
Tragic
$50,933
Jamaicans
4.4
/100
|
#230
Tragic
$50,929
Ugandans
4.3
/100
|
#231
Tragic
$50,923
Slovenes
4.0
/100
|
#232
Tragic
$50,886
Pennsylvania Germans
3.7
/100
|
#233
Tragic
$50,852
Kenyans
3.3
/100
|
#234
Tragic
$50,815