Immigrants from Eastern Europe vs Chilean Family Households
COMPARE
Immigrants from Eastern Europe
Chilean
Family Households
Family Households Comparison
Immigrants from Eastern Europe
Chileans
64.0%
FAMILY HOUSEHOLDS
17.2/ 100
METRIC RATING
201st/ 347
METRIC RANK
65.2%
FAMILY HOUSEHOLDS
98.1/ 100
METRIC RATING
101st/ 347
METRIC RANK
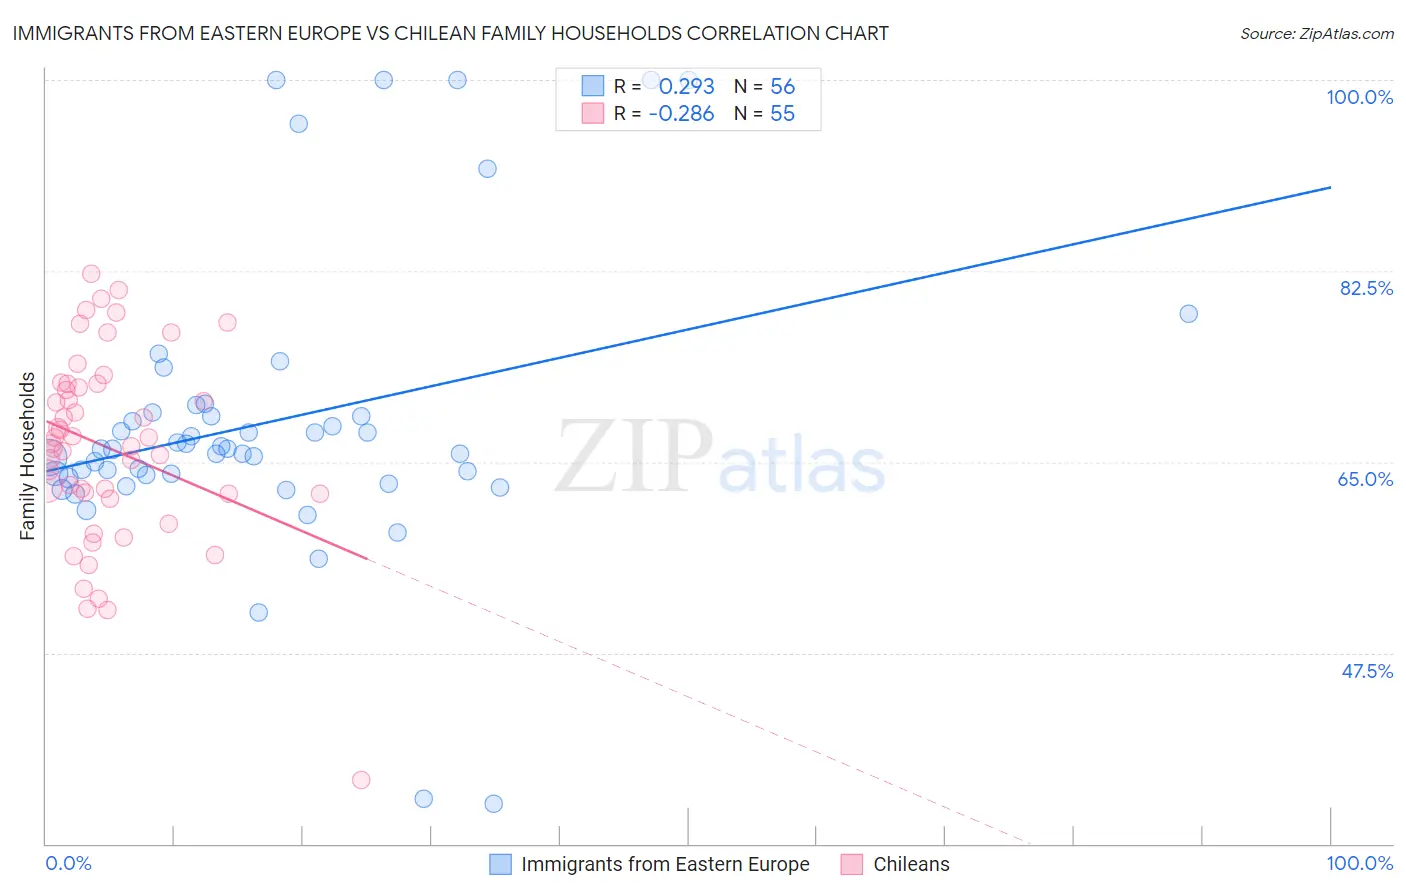
Immigrants from Eastern Europe vs Chilean Family Households Correlation Chart
The statistical analysis conducted on geographies consisting of 475,514,263 people shows a weak positive correlation between the proportion of Immigrants from Eastern Europe and percentage of family households in the United States with a correlation coefficient (R) of 0.293 and weighted average of 64.0%. Similarly, the statistical analysis conducted on geographies consisting of 256,564,731 people shows a weak negative correlation between the proportion of Chileans and percentage of family households in the United States with a correlation coefficient (R) of -0.286 and weighted average of 65.2%, a difference of 1.9%.
Family Households Correlation Summary
| Measurement | Immigrants from Eastern Europe | Chilean |
| Minimum | 33.7% | 35.8% |
| Maximum | 100.0% | 82.2% |
| Range | 66.3% | 46.4% |
| Mean | 68.7% | 66.3% |
| Median | 66.2% | 66.7% |
| Interquartile 25% (IQ1) | 63.7% | 62.0% |
| Interquartile 75% (IQ3) | 69.4% | 72.1% |
| Interquartile Range (IQR) | 5.7% | 10.1% |
| Standard Deviation (Sample) | 13.5% | 8.8% |
| Standard Deviation (Population) | 13.4% | 8.8% |
Similar Demographics by Family Households
Demographics Similar to Immigrants from Eastern Europe by Family Households
In terms of family households, the demographic groups most similar to Immigrants from Eastern Europe are Immigrants from Malaysia (64.0%, a difference of 0.020%), Slavic (64.0%, a difference of 0.030%), Immigrants from Canada (64.0%, a difference of 0.040%), Seminole (64.0%, a difference of 0.040%), and Polish (64.0%, a difference of 0.040%).
| Demographics | Rating | Rank | Family Households |
| Paiute | 22.2 /100 | #194 | Fair 64.0% |
| Immigrants | North America | 20.0 /100 | #195 | Poor 64.0% |
| Immigrants | Canada | 19.2 /100 | #196 | Poor 64.0% |
| Seminole | 18.9 /100 | #197 | Poor 64.0% |
| Poles | 18.9 /100 | #198 | Poor 64.0% |
| Slavs | 18.6 /100 | #199 | Poor 64.0% |
| Immigrants | Malaysia | 17.9 /100 | #200 | Poor 64.0% |
| Immigrants | Eastern Europe | 17.2 /100 | #201 | Poor 64.0% |
| Iranians | 13.5 /100 | #202 | Poor 63.9% |
| Norwegians | 13.2 /100 | #203 | Poor 63.9% |
| Immigrants | Uruguay | 12.8 /100 | #204 | Poor 63.9% |
| Brazilians | 12.4 /100 | #205 | Poor 63.9% |
| Immigrants | Lithuania | 12.1 /100 | #206 | Poor 63.9% |
| Nigerians | 11.5 /100 | #207 | Poor 63.9% |
| Immigrants | Bangladesh | 11.4 /100 | #208 | Poor 63.9% |
Demographics Similar to Chileans by Family Households
In terms of family households, the demographic groups most similar to Chileans are Haitian (65.2%, a difference of 0.0%), Immigrants from Sri Lanka (65.1%, a difference of 0.020%), Central American Indian (65.2%, a difference of 0.040%), Indian (Asian) (65.1%, a difference of 0.040%), and Spaniard (65.1%, a difference of 0.040%).
| Demographics | Rating | Rank | Family Households |
| Immigrants | Poland | 98.7 /100 | #94 | Exceptional 65.2% |
| Immigrants | Portugal | 98.6 /100 | #95 | Exceptional 65.2% |
| Swiss | 98.6 /100 | #96 | Exceptional 65.2% |
| Guatemalans | 98.6 /100 | #97 | Exceptional 65.2% |
| Immigrants | Syria | 98.4 /100 | #98 | Exceptional 65.2% |
| Central American Indians | 98.3 /100 | #99 | Exceptional 65.2% |
| Haitians | 98.1 /100 | #100 | Exceptional 65.2% |
| Chileans | 98.1 /100 | #101 | Exceptional 65.2% |
| Immigrants | Sri Lanka | 98.0 /100 | #102 | Exceptional 65.1% |
| Indians (Asian) | 97.9 /100 | #103 | Exceptional 65.1% |
| Spaniards | 97.8 /100 | #104 | Exceptional 65.1% |
| English | 97.4 /100 | #105 | Exceptional 65.1% |
| Whites/Caucasians | 97.3 /100 | #106 | Exceptional 65.1% |
| Alaska Natives | 97.3 /100 | #107 | Exceptional 65.1% |
| Palestinians | 97.2 /100 | #108 | Exceptional 65.1% |