Immigrants from Eastern Asia vs Soviet Union Median Family Income
COMPARE
Immigrants from Eastern Asia
Soviet Union
Median Family Income
Median Family Income Comparison
Immigrants from Eastern Asia
Soviet Union
$125,150
MEDIAN FAMILY INCOME
100.0/ 100
METRIC RATING
18th/ 347
METRIC RANK
$119,262
MEDIAN FAMILY INCOME
100.0/ 100
METRIC RATING
35th/ 347
METRIC RANK
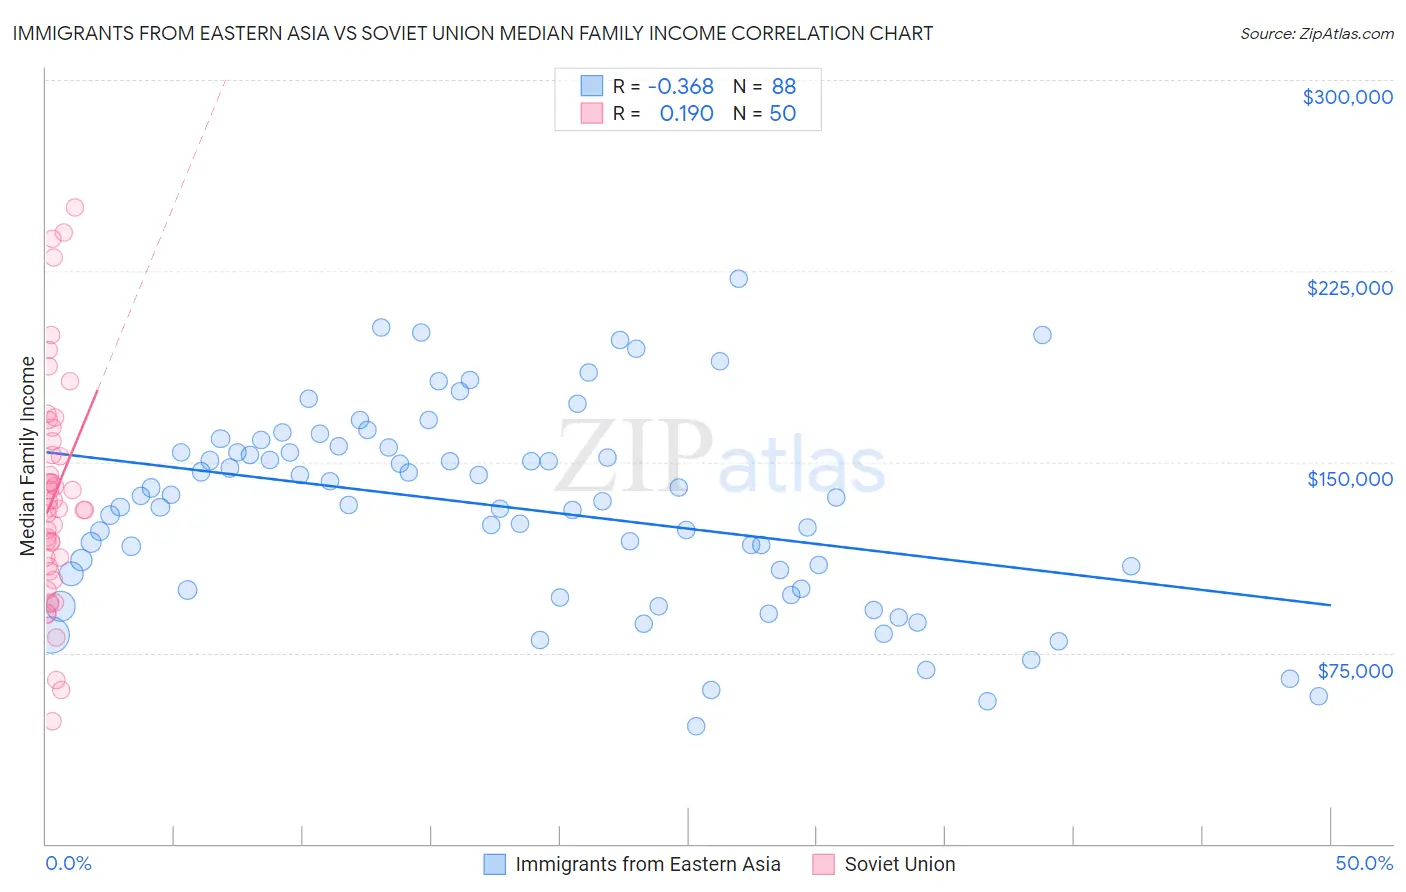
Immigrants from Eastern Asia vs Soviet Union Median Family Income Correlation Chart
The statistical analysis conducted on geographies consisting of 499,115,176 people shows a mild negative correlation between the proportion of Immigrants from Eastern Asia and median family income in the United States with a correlation coefficient (R) of -0.368 and weighted average of $125,150. Similarly, the statistical analysis conducted on geographies consisting of 43,509,630 people shows a poor positive correlation between the proportion of Soviet Union and median family income in the United States with a correlation coefficient (R) of 0.190 and weighted average of $119,262, a difference of 4.9%.
Median Family Income Correlation Summary
| Measurement | Immigrants from Eastern Asia | Soviet Union |
| Minimum | $46,207 | $48,254 |
| Maximum | $222,159 | $250,001 |
| Range | $175,952 | $201,747 |
| Mean | $131,947 | $137,051 |
| Median | $135,368 | $132,006 |
| Interquartile 25% (IQ1) | $103,059 | $109,232 |
| Interquartile 75% (IQ3) | $154,860 | $157,989 |
| Interquartile Range (IQR) | $51,801 | $48,757 |
| Standard Deviation (Sample) | $38,302 | $44,628 |
| Standard Deviation (Population) | $38,084 | $44,180 |
Demographics Similar to Immigrants from Eastern Asia and Soviet Union by Median Family Income
In terms of median family income, the demographic groups most similar to Immigrants from Eastern Asia are Indian (Asian) ($125,312, a difference of 0.13%), Immigrants from China ($125,540, a difference of 0.31%), Immigrants from Belgium ($123,831, a difference of 1.1%), Burmese ($123,369, a difference of 1.4%), and Immigrants from Korea ($122,800, a difference of 1.9%). Similarly, the demographic groups most similar to Soviet Union are Bolivian ($119,479, a difference of 0.18%), Bhutanese ($119,800, a difference of 0.45%), Asian ($119,955, a difference of 0.58%), Israeli ($118,577, a difference of 0.58%), and Immigrants from France ($120,076, a difference of 0.68%).
| Demographics | Rating | Rank | Median Family Income |
| Immigrants | China | 100.0 /100 | #16 | Exceptional $125,540 |
| Indians (Asian) | 100.0 /100 | #17 | Exceptional $125,312 |
| Immigrants | Eastern Asia | 100.0 /100 | #18 | Exceptional $125,150 |
| Immigrants | Belgium | 100.0 /100 | #19 | Exceptional $123,831 |
| Burmese | 100.0 /100 | #20 | Exceptional $123,369 |
| Immigrants | Korea | 100.0 /100 | #21 | Exceptional $122,800 |
| Immigrants | Sweden | 100.0 /100 | #22 | Exceptional $122,765 |
| Immigrants | Japan | 100.0 /100 | #23 | Exceptional $122,764 |
| Immigrants | Northern Europe | 100.0 /100 | #24 | Exceptional $121,840 |
| Turks | 100.0 /100 | #25 | Exceptional $121,202 |
| Immigrants | Switzerland | 100.0 /100 | #26 | Exceptional $120,726 |
| Russians | 100.0 /100 | #27 | Exceptional $120,487 |
| Immigrants | Denmark | 100.0 /100 | #28 | Exceptional $120,445 |
| Latvians | 100.0 /100 | #29 | Exceptional $120,301 |
| Immigrants | Sri Lanka | 100.0 /100 | #30 | Exceptional $120,263 |
| Immigrants | France | 100.0 /100 | #31 | Exceptional $120,076 |
| Asians | 100.0 /100 | #32 | Exceptional $119,955 |
| Bhutanese | 100.0 /100 | #33 | Exceptional $119,800 |
| Bolivians | 100.0 /100 | #34 | Exceptional $119,479 |
| Soviet Union | 100.0 /100 | #35 | Exceptional $119,262 |
| Israelis | 100.0 /100 | #36 | Exceptional $118,577 |