Immigrants from Eastern Africa vs Shoshone Per Capita Income
COMPARE
Immigrants from Eastern Africa
Shoshone
Per Capita Income
Per Capita Income Comparison
Immigrants from Eastern Africa
Shoshone
$43,838
PER CAPITA INCOME
54.9/ 100
METRIC RATING
171st/ 347
METRIC RANK
$37,072
PER CAPITA INCOME
0.1/ 100
METRIC RATING
302nd/ 347
METRIC RANK
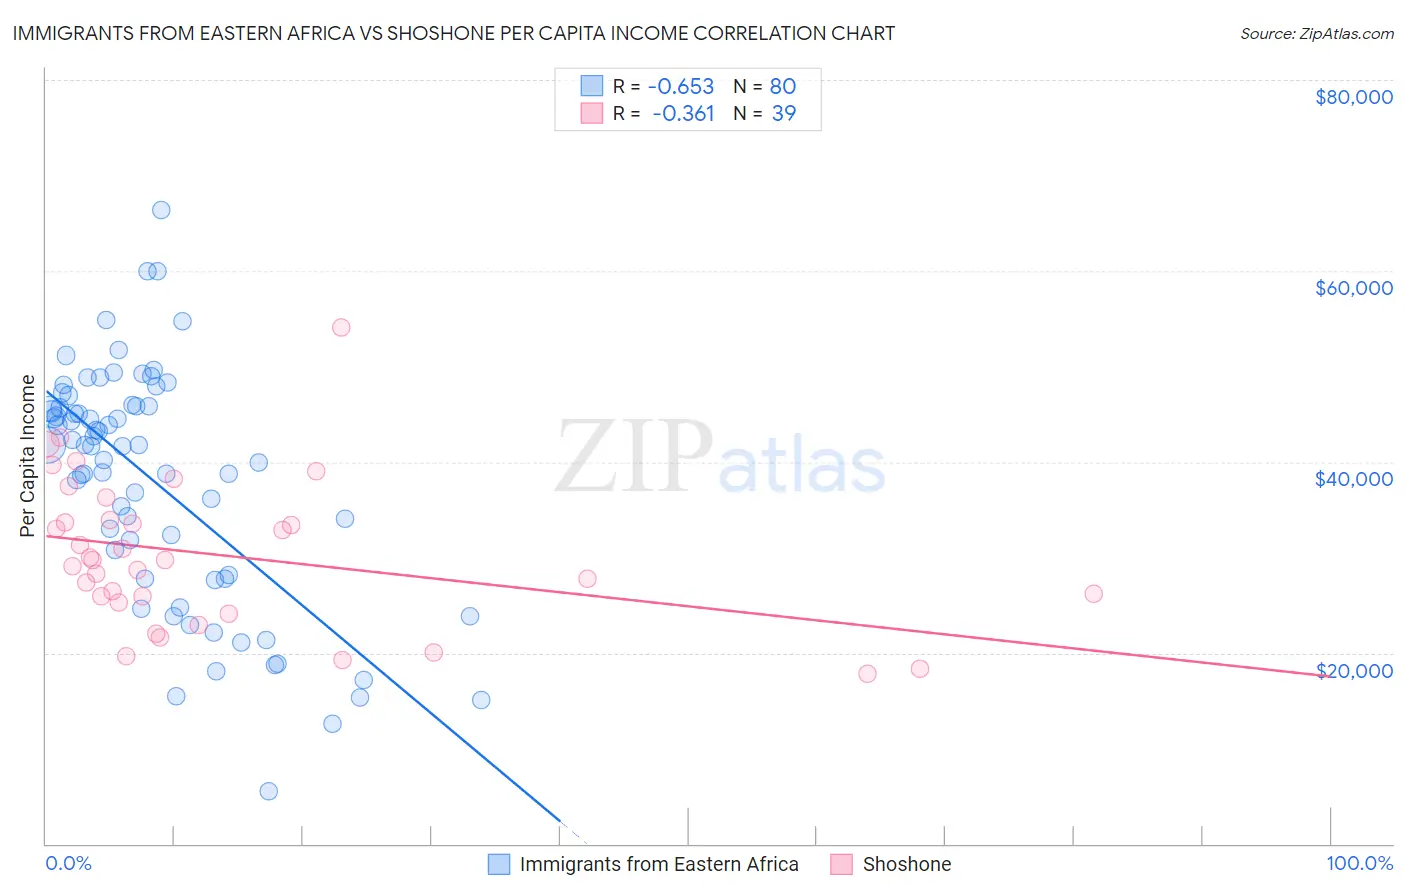
Immigrants from Eastern Africa vs Shoshone Per Capita Income Correlation Chart
The statistical analysis conducted on geographies consisting of 355,180,716 people shows a significant negative correlation between the proportion of Immigrants from Eastern Africa and per capita income in the United States with a correlation coefficient (R) of -0.653 and weighted average of $43,838. Similarly, the statistical analysis conducted on geographies consisting of 66,627,177 people shows a mild negative correlation between the proportion of Shoshone and per capita income in the United States with a correlation coefficient (R) of -0.361 and weighted average of $37,072, a difference of 18.2%.
Per Capita Income Correlation Summary
| Measurement | Immigrants from Eastern Africa | Shoshone |
| Minimum | $5,516 | $17,814 |
| Maximum | $66,352 | $54,019 |
| Range | $60,836 | $36,205 |
| Mean | $37,946 | $30,204 |
| Median | $41,723 | $29,691 |
| Interquartile 25% (IQ1) | $27,967 | $25,299 |
| Interquartile 75% (IQ3) | $45,811 | $33,868 |
| Interquartile Range (IQR) | $17,844 | $8,569 |
| Standard Deviation (Sample) | $12,344 | $7,800 |
| Standard Deviation (Population) | $12,266 | $7,700 |
Similar Demographics by Per Capita Income
Demographics Similar to Immigrants from Eastern Africa by Per Capita Income
In terms of per capita income, the demographic groups most similar to Immigrants from Eastern Africa are Scandinavian ($43,848, a difference of 0.020%), Immigrants from Peru ($43,852, a difference of 0.030%), Czechoslovakian ($43,806, a difference of 0.070%), Belgian ($43,951, a difference of 0.26%), and English ($43,982, a difference of 0.33%).
| Demographics | Rating | Rank | Per Capita Income |
| Sri Lankans | 59.8 /100 | #164 | Average $44,014 |
| Immigrants | Philippines | 59.4 /100 | #165 | Average $44,000 |
| Immigrants | Uruguay | 59.3 /100 | #166 | Average $43,997 |
| English | 58.9 /100 | #167 | Average $43,982 |
| Belgians | 58.1 /100 | #168 | Average $43,951 |
| Immigrants | Peru | 55.3 /100 | #169 | Average $43,852 |
| Scandinavians | 55.2 /100 | #170 | Average $43,848 |
| Immigrants | Eastern Africa | 54.9 /100 | #171 | Average $43,838 |
| Czechoslovakians | 54.1 /100 | #172 | Average $43,806 |
| French | 50.7 /100 | #173 | Average $43,685 |
| Colombians | 50.0 /100 | #174 | Average $43,661 |
| Celtics | 48.9 /100 | #175 | Average $43,621 |
| Immigrants | South Eastern Asia | 46.6 /100 | #176 | Average $43,539 |
| Tlingit-Haida | 45.9 /100 | #177 | Average $43,516 |
| Immigrants | Costa Rica | 44.5 /100 | #178 | Average $43,464 |
Demographics Similar to Shoshone by Per Capita Income
In terms of per capita income, the demographic groups most similar to Shoshone are Paiute ($37,066, a difference of 0.020%), Ottawa ($37,101, a difference of 0.080%), Honduran ($37,031, a difference of 0.11%), Inupiat ($36,999, a difference of 0.20%), and Immigrants from Bahamas ($37,193, a difference of 0.33%).
| Demographics | Rating | Rank | Per Capita Income |
| Immigrants | Dominican Republic | 0.1 /100 | #295 | Tragic $37,306 |
| Indonesians | 0.1 /100 | #296 | Tragic $37,300 |
| Haitians | 0.1 /100 | #297 | Tragic $37,289 |
| Immigrants | Caribbean | 0.1 /100 | #298 | Tragic $37,254 |
| Cherokee | 0.1 /100 | #299 | Tragic $37,203 |
| Immigrants | Bahamas | 0.1 /100 | #300 | Tragic $37,193 |
| Ottawa | 0.1 /100 | #301 | Tragic $37,101 |
| Shoshone | 0.1 /100 | #302 | Tragic $37,072 |
| Paiute | 0.1 /100 | #303 | Tragic $37,066 |
| Hondurans | 0.1 /100 | #304 | Tragic $37,031 |
| Inupiat | 0.1 /100 | #305 | Tragic $36,999 |
| Immigrants | Haiti | 0.0 /100 | #306 | Tragic $36,849 |
| Immigrants | Latin America | 0.0 /100 | #307 | Tragic $36,823 |
| Fijians | 0.0 /100 | #308 | Tragic $36,690 |
| Immigrants | Honduras | 0.0 /100 | #309 | Tragic $36,665 |