Immigrants from Eastern Africa vs Haitian Per Capita Income
COMPARE
Immigrants from Eastern Africa
Haitian
Per Capita Income
Per Capita Income Comparison
Immigrants from Eastern Africa
Haitians
$43,838
PER CAPITA INCOME
54.9/ 100
METRIC RATING
171st/ 347
METRIC RANK
$37,289
PER CAPITA INCOME
0.1/ 100
METRIC RATING
297th/ 347
METRIC RANK
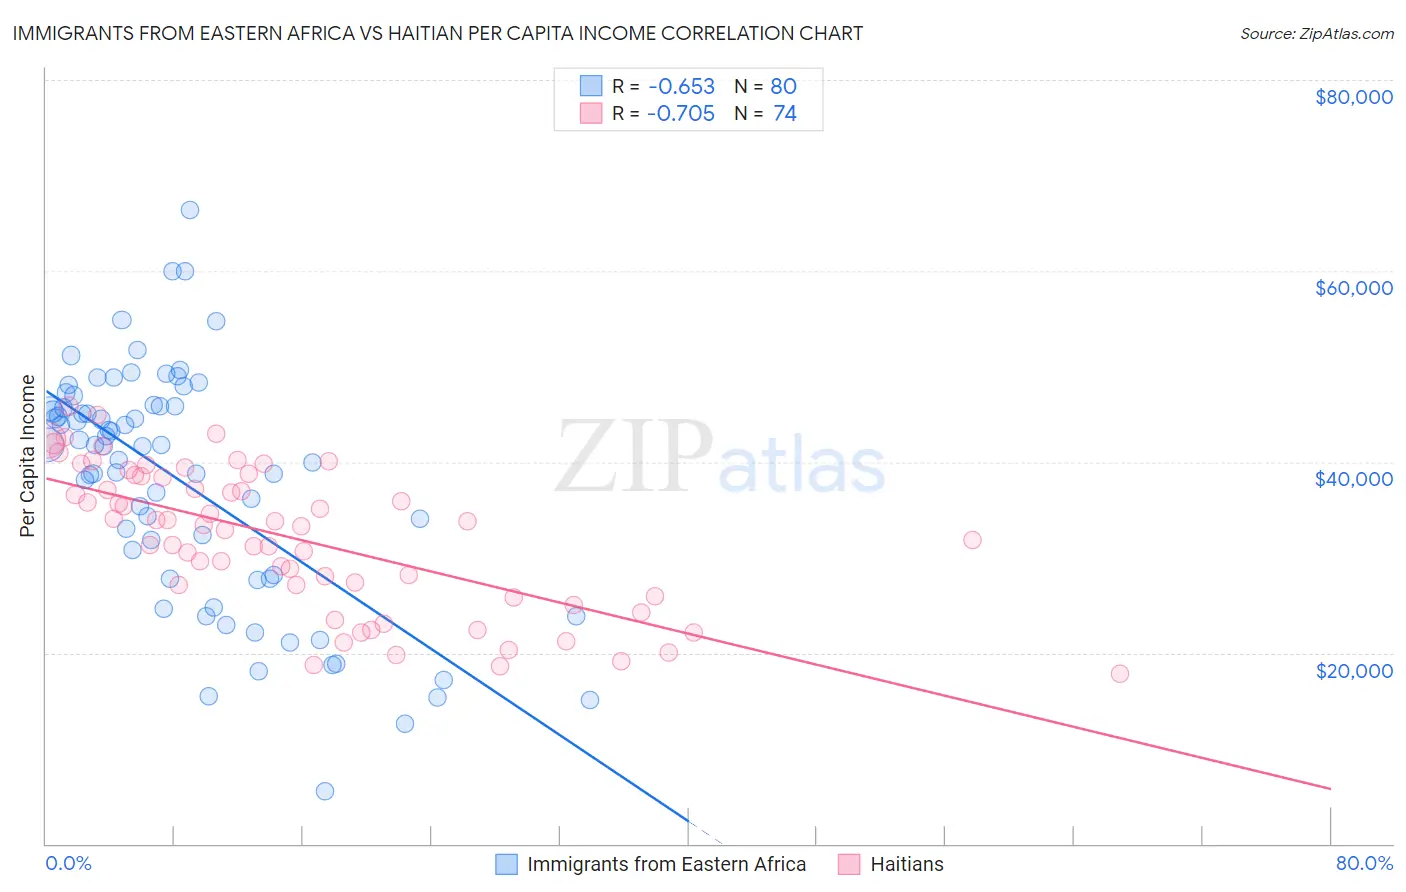
Immigrants from Eastern Africa vs Haitian Per Capita Income Correlation Chart
The statistical analysis conducted on geographies consisting of 355,180,716 people shows a significant negative correlation between the proportion of Immigrants from Eastern Africa and per capita income in the United States with a correlation coefficient (R) of -0.653 and weighted average of $43,838. Similarly, the statistical analysis conducted on geographies consisting of 288,031,086 people shows a strong negative correlation between the proportion of Haitians and per capita income in the United States with a correlation coefficient (R) of -0.705 and weighted average of $37,289, a difference of 17.6%.
Per Capita Income Correlation Summary
| Measurement | Immigrants from Eastern Africa | Haitian |
| Minimum | $5,516 | $17,858 |
| Maximum | $66,352 | $45,871 |
| Range | $60,836 | $28,013 |
| Mean | $37,946 | $31,987 |
| Median | $41,723 | $33,320 |
| Interquartile 25% (IQ1) | $27,967 | $25,885 |
| Interquartile 75% (IQ3) | $45,811 | $38,541 |
| Interquartile Range (IQR) | $17,844 | $12,656 |
| Standard Deviation (Sample) | $12,344 | $7,480 |
| Standard Deviation (Population) | $12,266 | $7,429 |
Similar Demographics by Per Capita Income
Demographics Similar to Immigrants from Eastern Africa by Per Capita Income
In terms of per capita income, the demographic groups most similar to Immigrants from Eastern Africa are Scandinavian ($43,848, a difference of 0.020%), Immigrants from Peru ($43,852, a difference of 0.030%), Czechoslovakian ($43,806, a difference of 0.070%), Belgian ($43,951, a difference of 0.26%), and English ($43,982, a difference of 0.33%).
| Demographics | Rating | Rank | Per Capita Income |
| Sri Lankans | 59.8 /100 | #164 | Average $44,014 |
| Immigrants | Philippines | 59.4 /100 | #165 | Average $44,000 |
| Immigrants | Uruguay | 59.3 /100 | #166 | Average $43,997 |
| English | 58.9 /100 | #167 | Average $43,982 |
| Belgians | 58.1 /100 | #168 | Average $43,951 |
| Immigrants | Peru | 55.3 /100 | #169 | Average $43,852 |
| Scandinavians | 55.2 /100 | #170 | Average $43,848 |
| Immigrants | Eastern Africa | 54.9 /100 | #171 | Average $43,838 |
| Czechoslovakians | 54.1 /100 | #172 | Average $43,806 |
| French | 50.7 /100 | #173 | Average $43,685 |
| Colombians | 50.0 /100 | #174 | Average $43,661 |
| Celtics | 48.9 /100 | #175 | Average $43,621 |
| Immigrants | South Eastern Asia | 46.6 /100 | #176 | Average $43,539 |
| Tlingit-Haida | 45.9 /100 | #177 | Average $43,516 |
| Immigrants | Costa Rica | 44.5 /100 | #178 | Average $43,464 |
Demographics Similar to Haitians by Per Capita Income
In terms of per capita income, the demographic groups most similar to Haitians are Indonesian ($37,300, a difference of 0.030%), Immigrants from Dominican Republic ($37,306, a difference of 0.040%), Immigrants from Caribbean ($37,254, a difference of 0.090%), Cherokee ($37,203, a difference of 0.23%), and Cuban ($37,383, a difference of 0.25%).
| Demographics | Rating | Rank | Per Capita Income |
| Immigrants | Guatemala | 0.1 /100 | #290 | Tragic $37,550 |
| Cajuns | 0.1 /100 | #291 | Tragic $37,527 |
| Immigrants | Micronesia | 0.1 /100 | #292 | Tragic $37,464 |
| Mexican American Indians | 0.1 /100 | #293 | Tragic $37,407 |
| Cubans | 0.1 /100 | #294 | Tragic $37,383 |
| Immigrants | Dominican Republic | 0.1 /100 | #295 | Tragic $37,306 |
| Indonesians | 0.1 /100 | #296 | Tragic $37,300 |
| Haitians | 0.1 /100 | #297 | Tragic $37,289 |
| Immigrants | Caribbean | 0.1 /100 | #298 | Tragic $37,254 |
| Cherokee | 0.1 /100 | #299 | Tragic $37,203 |
| Immigrants | Bahamas | 0.1 /100 | #300 | Tragic $37,193 |
| Ottawa | 0.1 /100 | #301 | Tragic $37,101 |
| Shoshone | 0.1 /100 | #302 | Tragic $37,072 |
| Paiute | 0.1 /100 | #303 | Tragic $37,066 |
| Hondurans | 0.1 /100 | #304 | Tragic $37,031 |