Basque vs Cape Verdean Median Household Income
COMPARE
Basque
Cape Verdean
Median Household Income
Median Household Income Comparison
Basques
Cape Verdeans
$87,001
MEDIAN HOUSEHOLD INCOME
77.2/ 100
METRIC RATING
150th/ 347
METRIC RANK
$75,848
MEDIAN HOUSEHOLD INCOME
0.3/ 100
METRIC RATING
269th/ 347
METRIC RANK
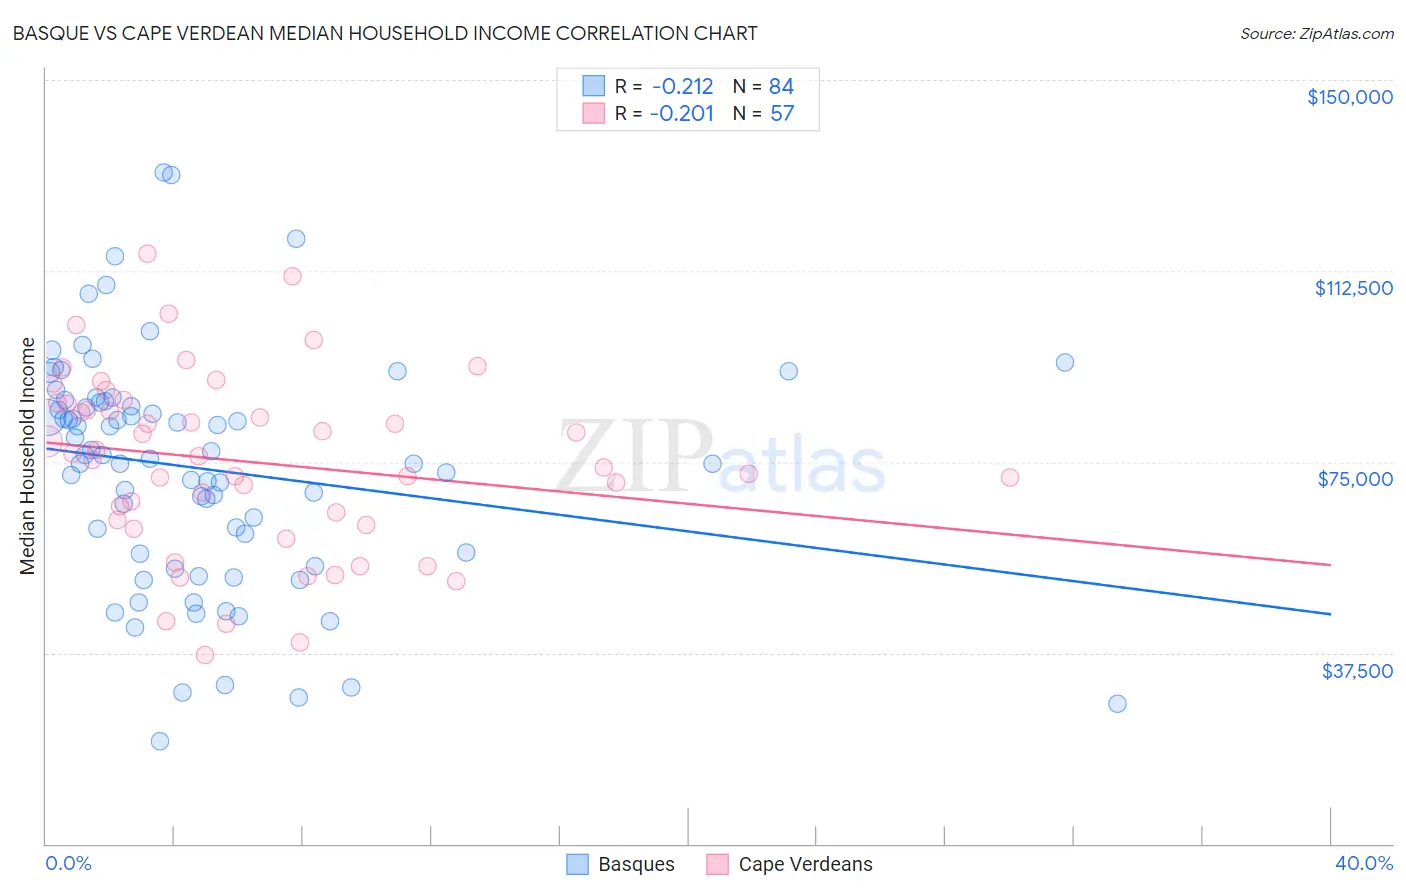
Basque vs Cape Verdean Median Household Income Correlation Chart
The statistical analysis conducted on geographies consisting of 165,746,357 people shows a weak negative correlation between the proportion of Basques and median household income in the United States with a correlation coefficient (R) of -0.212 and weighted average of $87,001. Similarly, the statistical analysis conducted on geographies consisting of 107,534,548 people shows a weak negative correlation between the proportion of Cape Verdeans and median household income in the United States with a correlation coefficient (R) of -0.201 and weighted average of $75,848, a difference of 14.7%.
Median Household Income Correlation Summary
| Measurement | Basque | Cape Verdean |
| Minimum | $20,139 | $37,158 |
| Maximum | $131,838 | $115,791 |
| Range | $111,699 | $78,633 |
| Mean | $73,627 | $75,036 |
| Median | $76,033 | $76,048 |
| Interquartile 25% (IQ1) | $57,079 | $63,051 |
| Interquartile 75% (IQ3) | $86,843 | $86,492 |
| Interquartile Range (IQR) | $29,764 | $23,441 |
| Standard Deviation (Sample) | $22,838 | $17,562 |
| Standard Deviation (Population) | $22,701 | $17,408 |
Similar Demographics by Median Household Income
Demographics Similar to Basques by Median Household Income
In terms of median household income, the demographic groups most similar to Basques are Immigrants from Nepal ($87,046, a difference of 0.050%), Hungarian ($86,920, a difference of 0.090%), Immigrants from Saudi Arabia ($86,875, a difference of 0.15%), South American ($86,824, a difference of 0.20%), and Immigrants from Germany ($86,764, a difference of 0.27%).
| Demographics | Rating | Rank | Median Household Income |
| Danes | 83.9 /100 | #143 | Excellent $87,676 |
| Serbians | 83.0 /100 | #144 | Excellent $87,572 |
| Ugandans | 82.9 /100 | #145 | Excellent $87,557 |
| Immigrants | Uganda | 82.8 /100 | #146 | Excellent $87,553 |
| South American Indians | 81.8 /100 | #147 | Excellent $87,446 |
| Costa Ricans | 80.0 /100 | #148 | Excellent $87,262 |
| Immigrants | Nepal | 77.7 /100 | #149 | Good $87,046 |
| Basques | 77.2 /100 | #150 | Good $87,001 |
| Hungarians | 76.3 /100 | #151 | Good $86,920 |
| Immigrants | Saudi Arabia | 75.8 /100 | #152 | Good $86,875 |
| South Americans | 75.1 /100 | #153 | Good $86,824 |
| Immigrants | Germany | 74.4 /100 | #154 | Good $86,764 |
| Carpatho Rusyns | 72.8 /100 | #155 | Good $86,635 |
| Immigrants | Albania | 71.5 /100 | #156 | Good $86,534 |
| Samoans | 71.0 /100 | #157 | Good $86,498 |
Demographics Similar to Cape Verdeans by Median Household Income
In terms of median household income, the demographic groups most similar to Cape Verdeans are Immigrants from Jamaica ($75,851, a difference of 0.0%), German Russian ($75,856, a difference of 0.010%), Hmong ($75,839, a difference of 0.010%), Pennsylvania German ($75,814, a difference of 0.050%), and Somali ($75,782, a difference of 0.090%).
| Demographics | Rating | Rank | Median Household Income |
| French American Indians | 0.4 /100 | #262 | Tragic $76,387 |
| Alaskan Athabascans | 0.4 /100 | #263 | Tragic $76,383 |
| Guatemalans | 0.3 /100 | #264 | Tragic $75,961 |
| Immigrants | Belize | 0.3 /100 | #265 | Tragic $75,938 |
| Americans | 0.3 /100 | #266 | Tragic $75,932 |
| German Russians | 0.3 /100 | #267 | Tragic $75,856 |
| Immigrants | Jamaica | 0.3 /100 | #268 | Tragic $75,851 |
| Cape Verdeans | 0.3 /100 | #269 | Tragic $75,848 |
| Hmong | 0.3 /100 | #270 | Tragic $75,839 |
| Pennsylvania Germans | 0.3 /100 | #271 | Tragic $75,814 |
| Somalis | 0.3 /100 | #272 | Tragic $75,782 |
| Liberians | 0.2 /100 | #273 | Tragic $75,667 |
| British West Indians | 0.2 /100 | #274 | Tragic $75,647 |
| Immigrants | Micronesia | 0.2 /100 | #275 | Tragic $75,574 |
| Immigrants | Latin America | 0.2 /100 | #276 | Tragic $75,420 |