Immigrants from Denmark vs French Canadian Householder Income Under 25 years
COMPARE
Immigrants from Denmark
French Canadian
Householder Income Under 25 years
Householder Income Under 25 years Comparison
Immigrants from Denmark
French Canadians
$52,612
HOUSEHOLDER INCOME UNDER 25 YEARS
73.8/ 100
METRIC RATING
155th/ 347
METRIC RANK
$52,672
HOUSEHOLDER INCOME UNDER 25 YEARS
76.5/ 100
METRIC RATING
148th/ 347
METRIC RANK
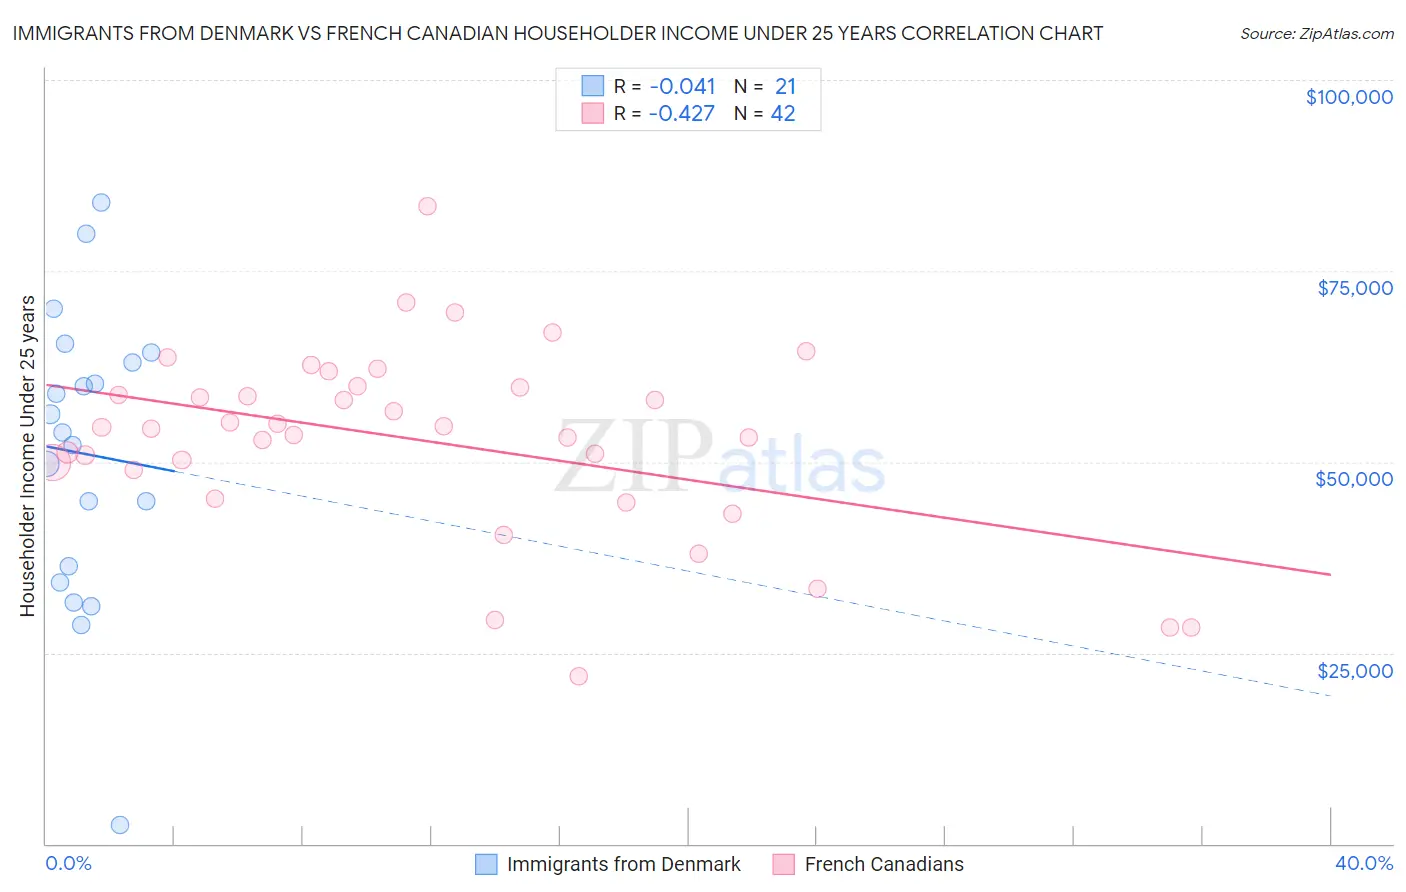
Immigrants from Denmark vs French Canadian Householder Income Under 25 years Correlation Chart
The statistical analysis conducted on geographies consisting of 123,999,951 people shows no correlation between the proportion of Immigrants from Denmark and household income with householder under the age of 25 in the United States with a correlation coefficient (R) of -0.041 and weighted average of $52,612. Similarly, the statistical analysis conducted on geographies consisting of 404,051,752 people shows a moderate negative correlation between the proportion of French Canadians and household income with householder under the age of 25 in the United States with a correlation coefficient (R) of -0.427 and weighted average of $52,672, a difference of 0.11%.
Householder Income Under 25 years Correlation Summary
| Measurement | Immigrants from Denmark | French Canadian |
| Minimum | $2,499 | $21,875 |
| Maximum | $84,000 | $83,420 |
| Range | $81,501 | $61,545 |
| Mean | $51,040 | $52,741 |
| Median | $53,874 | $54,485 |
| Interquartile 25% (IQ1) | $35,276 | $49,010 |
| Interquartile 75% (IQ3) | $63,691 | $59,797 |
| Interquartile Range (IQR) | $28,415 | $10,788 |
| Standard Deviation (Sample) | $19,074 | $12,369 |
| Standard Deviation (Population) | $18,615 | $12,221 |
Demographics Similar to Immigrants from Denmark and French Canadians by Householder Income Under 25 years
In terms of householder income under 25 years, the demographic groups most similar to Immigrants from Denmark are Immigrants from Nepal ($52,611, a difference of 0.0%), Immigrants from the Azores ($52,621, a difference of 0.020%), Central American ($52,626, a difference of 0.030%), Trinidadian and Tobagonian ($52,631, a difference of 0.040%), and Ghanaian ($52,594, a difference of 0.040%). Similarly, the demographic groups most similar to French Canadians are Scandinavian ($52,654, a difference of 0.030%), Immigrants from Costa Rica ($52,643, a difference of 0.060%), Immigrants from Scotland ($52,638, a difference of 0.060%), Trinidadian and Tobagonian ($52,631, a difference of 0.080%), and Central American ($52,626, a difference of 0.090%).
| Demographics | Rating | Rank | Householder Income Under 25 years |
| Danes | 88.9 /100 | #141 | Excellent $53,041 |
| Immigrants | Armenia | 87.5 /100 | #142 | Excellent $52,986 |
| Swedes | 87.5 /100 | #143 | Excellent $52,986 |
| South American Indians | 87.3 /100 | #144 | Excellent $52,979 |
| Immigrants | Western Europe | 86.7 /100 | #145 | Excellent $52,957 |
| Immigrants | Hungary | 81.6 /100 | #146 | Excellent $52,798 |
| Latvians | 81.0 /100 | #147 | Excellent $52,783 |
| French Canadians | 76.5 /100 | #148 | Good $52,672 |
| Scandinavians | 75.7 /100 | #149 | Good $52,654 |
| Immigrants | Costa Rica | 75.2 /100 | #150 | Good $52,643 |
| Immigrants | Scotland | 75.0 /100 | #151 | Good $52,638 |
| Trinidadians and Tobagonians | 74.6 /100 | #152 | Good $52,631 |
| Central Americans | 74.4 /100 | #153 | Good $52,626 |
| Immigrants | Azores | 74.2 /100 | #154 | Good $52,621 |
| Immigrants | Denmark | 73.8 /100 | #155 | Good $52,612 |
| Immigrants | Nepal | 73.7 /100 | #156 | Good $52,611 |
| Ghanaians | 72.9 /100 | #157 | Good $52,594 |
| Immigrants | Netherlands | 72.8 /100 | #158 | Good $52,592 |
| Mongolians | 70.2 /100 | #159 | Good $52,540 |
| Immigrants | Turkey | 68.3 /100 | #160 | Good $52,503 |
| Uruguayans | 66.2 /100 | #161 | Good $52,465 |