Immigrants from Denmark vs Immigrants from Japan Householder Income Under 25 years
COMPARE
Immigrants from Denmark
Immigrants from Japan
Householder Income Under 25 years
Householder Income Under 25 years Comparison
Immigrants from Denmark
Immigrants from Japan
$52,612
HOUSEHOLDER INCOME UNDER 25 YEARS
73.8/ 100
METRIC RATING
155th/ 347
METRIC RANK
$55,932
HOUSEHOLDER INCOME UNDER 25 YEARS
100.0/ 100
METRIC RATING
34th/ 347
METRIC RANK
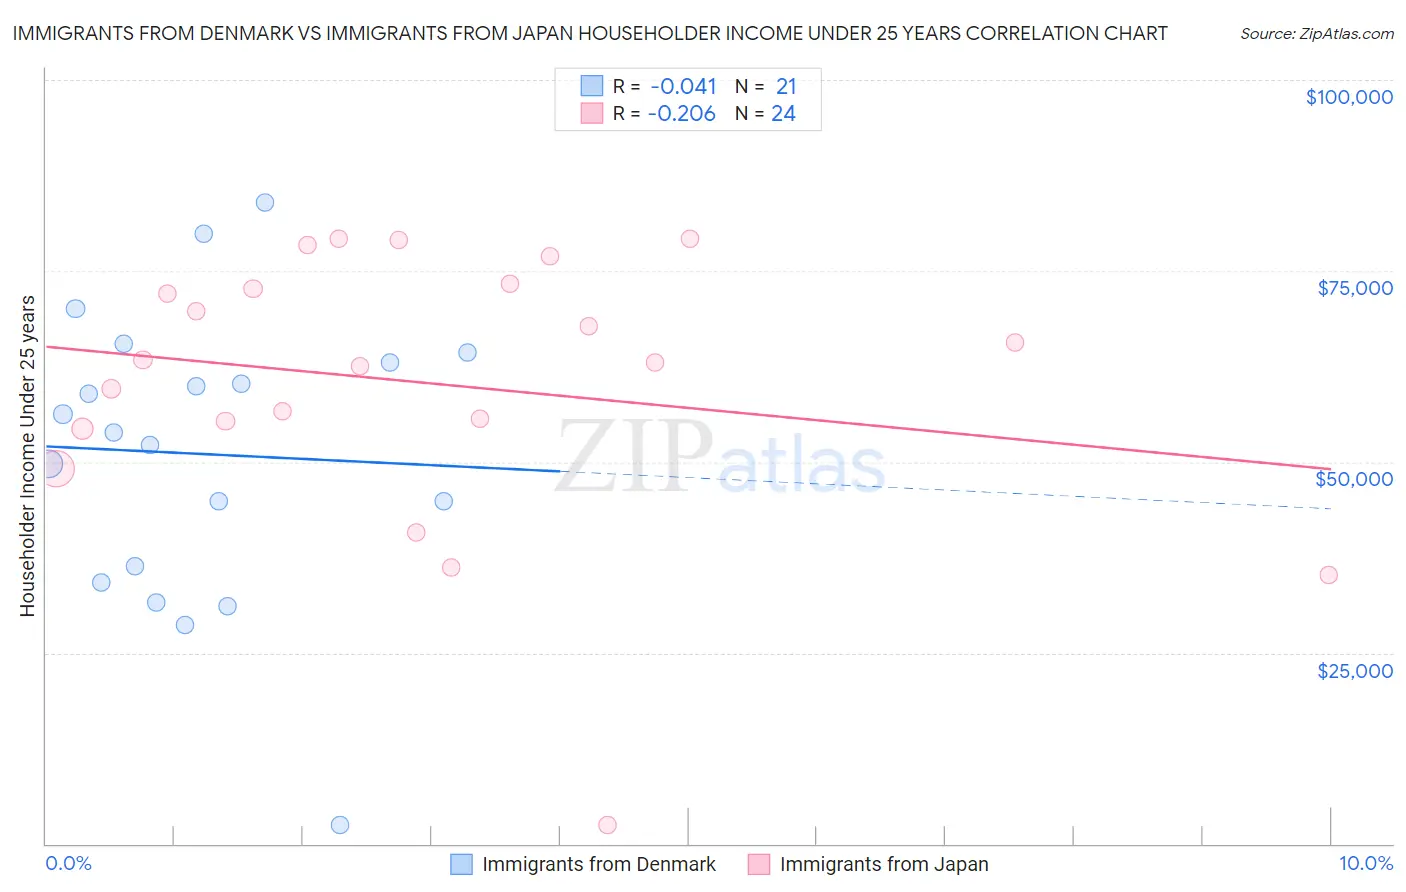
Immigrants from Denmark vs Immigrants from Japan Householder Income Under 25 years Correlation Chart
The statistical analysis conducted on geographies consisting of 123,999,951 people shows no correlation between the proportion of Immigrants from Denmark and household income with householder under the age of 25 in the United States with a correlation coefficient (R) of -0.041 and weighted average of $52,612. Similarly, the statistical analysis conducted on geographies consisting of 293,469,097 people shows a weak negative correlation between the proportion of Immigrants from Japan and household income with householder under the age of 25 in the United States with a correlation coefficient (R) of -0.206 and weighted average of $55,932, a difference of 6.3%.
Householder Income Under 25 years Correlation Summary
| Measurement | Immigrants from Denmark | Immigrants from Japan |
| Minimum | $2,499 | $2,499 |
| Maximum | $84,000 | $79,188 |
| Range | $81,501 | $76,689 |
| Mean | $51,040 | $60,335 |
| Median | $53,874 | $63,191 |
| Interquartile 25% (IQ1) | $35,276 | $54,827 |
| Interquartile 75% (IQ3) | $63,691 | $72,990 |
| Interquartile Range (IQR) | $28,415 | $18,164 |
| Standard Deviation (Sample) | $19,074 | $18,036 |
| Standard Deviation (Population) | $18,615 | $17,656 |
Similar Demographics by Householder Income Under 25 years
Demographics Similar to Immigrants from Denmark by Householder Income Under 25 years
In terms of householder income under 25 years, the demographic groups most similar to Immigrants from Denmark are Immigrants from Nepal ($52,611, a difference of 0.0%), Immigrants from the Azores ($52,621, a difference of 0.020%), Central American ($52,626, a difference of 0.030%), Trinidadian and Tobagonian ($52,631, a difference of 0.040%), and Ghanaian ($52,594, a difference of 0.040%).
| Demographics | Rating | Rank | Householder Income Under 25 years |
| French Canadians | 76.5 /100 | #148 | Good $52,672 |
| Scandinavians | 75.7 /100 | #149 | Good $52,654 |
| Immigrants | Costa Rica | 75.2 /100 | #150 | Good $52,643 |
| Immigrants | Scotland | 75.0 /100 | #151 | Good $52,638 |
| Trinidadians and Tobagonians | 74.6 /100 | #152 | Good $52,631 |
| Central Americans | 74.4 /100 | #153 | Good $52,626 |
| Immigrants | Azores | 74.2 /100 | #154 | Good $52,621 |
| Immigrants | Denmark | 73.8 /100 | #155 | Good $52,612 |
| Immigrants | Nepal | 73.7 /100 | #156 | Good $52,611 |
| Ghanaians | 72.9 /100 | #157 | Good $52,594 |
| Immigrants | Netherlands | 72.8 /100 | #158 | Good $52,592 |
| Mongolians | 70.2 /100 | #159 | Good $52,540 |
| Immigrants | Turkey | 68.3 /100 | #160 | Good $52,503 |
| Uruguayans | 66.2 /100 | #161 | Good $52,465 |
| Immigrants | Cambodia | 65.4 /100 | #162 | Good $52,450 |
Demographics Similar to Immigrants from Japan by Householder Income Under 25 years
In terms of householder income under 25 years, the demographic groups most similar to Immigrants from Japan are Inupiat ($55,935, a difference of 0.010%), Tlingit-Haida ($55,914, a difference of 0.030%), Immigrants from Israel ($55,913, a difference of 0.030%), Immigrants from Russia ($55,891, a difference of 0.070%), and Immigrants from Iran ($55,880, a difference of 0.090%).
| Demographics | Rating | Rank | Householder Income Under 25 years |
| Immigrants | North Macedonia | 100.0 /100 | #27 | Exceptional $56,503 |
| Immigrants | Peru | 100.0 /100 | #28 | Exceptional $56,384 |
| Immigrants | Asia | 100.0 /100 | #29 | Exceptional $56,379 |
| Immigrants | Moldova | 100.0 /100 | #30 | Exceptional $56,168 |
| Vietnamese | 100.0 /100 | #31 | Exceptional $56,127 |
| Peruvians | 100.0 /100 | #32 | Exceptional $56,052 |
| Inupiat | 100.0 /100 | #33 | Exceptional $55,935 |
| Immigrants | Japan | 100.0 /100 | #34 | Exceptional $55,932 |
| Tlingit-Haida | 100.0 /100 | #35 | Exceptional $55,914 |
| Immigrants | Israel | 100.0 /100 | #36 | Exceptional $55,913 |
| Immigrants | Russia | 100.0 /100 | #37 | Exceptional $55,891 |
| Immigrants | Iran | 100.0 /100 | #38 | Exceptional $55,880 |
| Immigrants | Belarus | 100.0 /100 | #39 | Exceptional $55,743 |
| Immigrants | Greece | 100.0 /100 | #40 | Exceptional $55,727 |
| Immigrants | Guyana | 100.0 /100 | #41 | Exceptional $55,726 |