Immigrants from Denmark vs Immigrants from Ukraine Householder Income Under 25 years
COMPARE
Immigrants from Denmark
Immigrants from Ukraine
Householder Income Under 25 years
Householder Income Under 25 years Comparison
Immigrants from Denmark
Immigrants from Ukraine
$52,612
HOUSEHOLDER INCOME UNDER 25 YEARS
73.8/ 100
METRIC RATING
155th/ 347
METRIC RANK
$55,447
HOUSEHOLDER INCOME UNDER 25 YEARS
100.0/ 100
METRIC RATING
55th/ 347
METRIC RANK
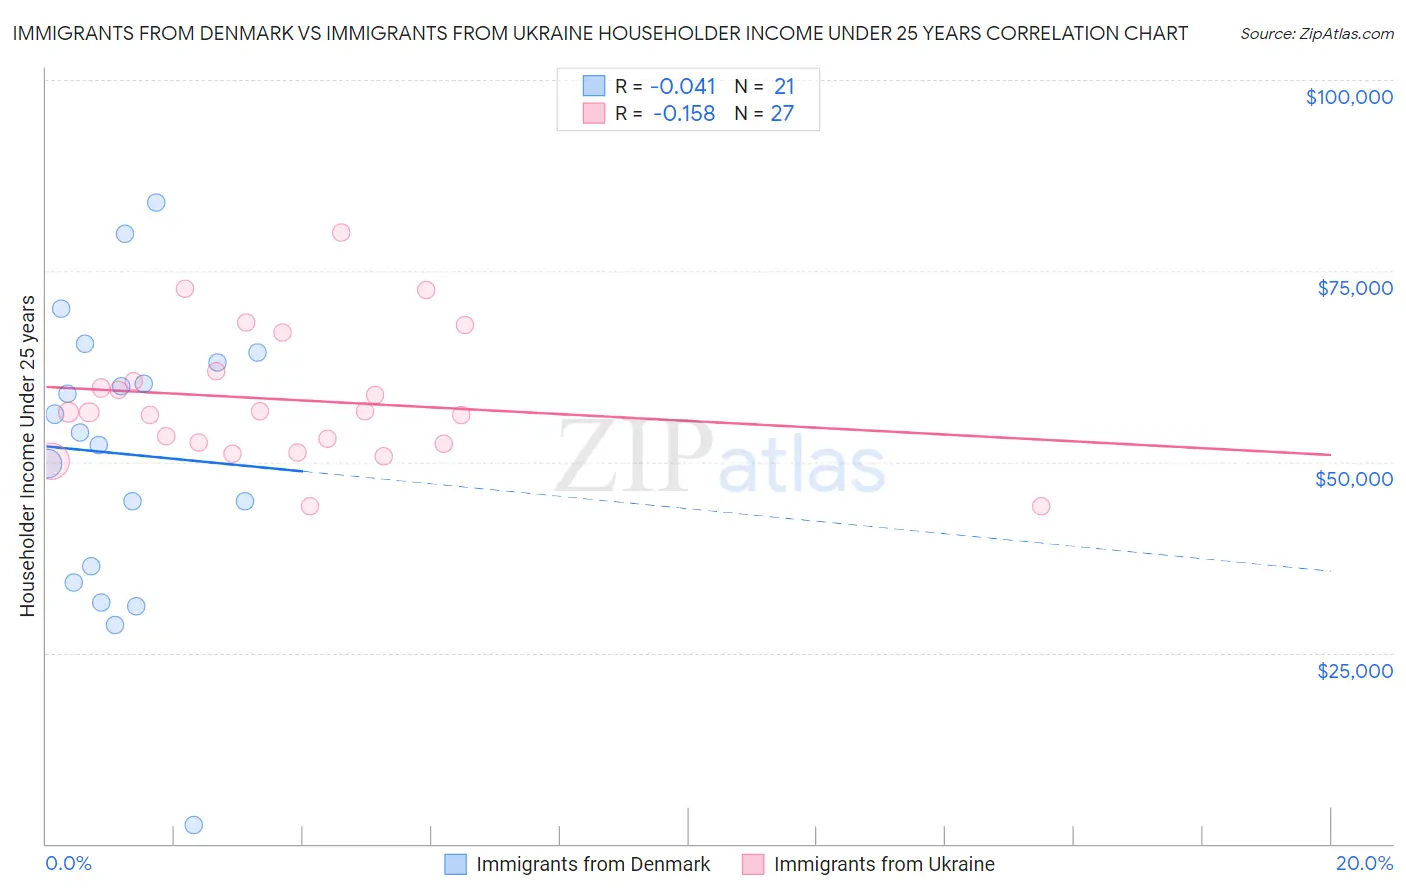
Immigrants from Denmark vs Immigrants from Ukraine Householder Income Under 25 years Correlation Chart
The statistical analysis conducted on geographies consisting of 123,999,951 people shows no correlation between the proportion of Immigrants from Denmark and household income with householder under the age of 25 in the United States with a correlation coefficient (R) of -0.041 and weighted average of $52,612. Similarly, the statistical analysis conducted on geographies consisting of 247,734,480 people shows a poor negative correlation between the proportion of Immigrants from Ukraine and household income with householder under the age of 25 in the United States with a correlation coefficient (R) of -0.158 and weighted average of $55,447, a difference of 5.4%.
Householder Income Under 25 years Correlation Summary
| Measurement | Immigrants from Denmark | Immigrants from Ukraine |
| Minimum | $2,499 | $44,212 |
| Maximum | $84,000 | $80,041 |
| Range | $81,501 | $35,830 |
| Mean | $51,040 | $58,153 |
| Median | $53,874 | $56,546 |
| Interquartile 25% (IQ1) | $35,276 | $52,321 |
| Interquartile 75% (IQ3) | $63,691 | $61,864 |
| Interquartile Range (IQR) | $28,415 | $9,543 |
| Standard Deviation (Sample) | $19,074 | $8,615 |
| Standard Deviation (Population) | $18,615 | $8,454 |
Similar Demographics by Householder Income Under 25 years
Demographics Similar to Immigrants from Denmark by Householder Income Under 25 years
In terms of householder income under 25 years, the demographic groups most similar to Immigrants from Denmark are Immigrants from Nepal ($52,611, a difference of 0.0%), Immigrants from the Azores ($52,621, a difference of 0.020%), Central American ($52,626, a difference of 0.030%), Trinidadian and Tobagonian ($52,631, a difference of 0.040%), and Ghanaian ($52,594, a difference of 0.040%).
| Demographics | Rating | Rank | Householder Income Under 25 years |
| French Canadians | 76.5 /100 | #148 | Good $52,672 |
| Scandinavians | 75.7 /100 | #149 | Good $52,654 |
| Immigrants | Costa Rica | 75.2 /100 | #150 | Good $52,643 |
| Immigrants | Scotland | 75.0 /100 | #151 | Good $52,638 |
| Trinidadians and Tobagonians | 74.6 /100 | #152 | Good $52,631 |
| Central Americans | 74.4 /100 | #153 | Good $52,626 |
| Immigrants | Azores | 74.2 /100 | #154 | Good $52,621 |
| Immigrants | Denmark | 73.8 /100 | #155 | Good $52,612 |
| Immigrants | Nepal | 73.7 /100 | #156 | Good $52,611 |
| Ghanaians | 72.9 /100 | #157 | Good $52,594 |
| Immigrants | Netherlands | 72.8 /100 | #158 | Good $52,592 |
| Mongolians | 70.2 /100 | #159 | Good $52,540 |
| Immigrants | Turkey | 68.3 /100 | #160 | Good $52,503 |
| Uruguayans | 66.2 /100 | #161 | Good $52,465 |
| Immigrants | Cambodia | 65.4 /100 | #162 | Good $52,450 |
Demographics Similar to Immigrants from Ukraine by Householder Income Under 25 years
In terms of householder income under 25 years, the demographic groups most similar to Immigrants from Ukraine are Sri Lankan ($55,470, a difference of 0.040%), Immigrants from Poland ($55,474, a difference of 0.050%), Salvadoran ($55,412, a difference of 0.060%), Immigrants from Romania ($55,522, a difference of 0.13%), and Immigrants from Indonesia ($55,521, a difference of 0.13%).
| Demographics | Rating | Rank | Householder Income Under 25 years |
| Immigrants | Vietnam | 100.0 /100 | #48 | Exceptional $55,562 |
| Iranians | 100.0 /100 | #49 | Exceptional $55,548 |
| Puget Sound Salish | 100.0 /100 | #50 | Exceptional $55,543 |
| Immigrants | Romania | 100.0 /100 | #51 | Exceptional $55,522 |
| Immigrants | Indonesia | 100.0 /100 | #52 | Exceptional $55,521 |
| Immigrants | Poland | 100.0 /100 | #53 | Exceptional $55,474 |
| Sri Lankans | 100.0 /100 | #54 | Exceptional $55,470 |
| Immigrants | Ukraine | 100.0 /100 | #55 | Exceptional $55,447 |
| Salvadorans | 100.0 /100 | #56 | Exceptional $55,412 |
| Soviet Union | 100.0 /100 | #57 | Exceptional $55,340 |
| Guyanese | 99.9 /100 | #58 | Exceptional $55,210 |
| Native Hawaiians | 99.9 /100 | #59 | Exceptional $55,158 |
| Immigrants | Lithuania | 99.9 /100 | #60 | Exceptional $55,028 |
| Immigrants | Europe | 99.9 /100 | #61 | Exceptional $55,022 |
| Immigrants | Uzbekistan | 99.8 /100 | #62 | Exceptional $54,846 |