Dutch West Indian vs Immigrants from Ukraine Householder Income Under 25 years

COMPARE

Dutch West Indian
Race
Ancestry
AfghanAfricanAlaska NativeAlaskan AthabascanAlbanianAleutAlsatianAmericanApacheArabArapahoArgentineanArmenianAssyrian/Chaldean/SyriacAustralianAustrianBahamianBangladeshiBarbadianBasqueBelgianBelizeanBermudanBhutaneseBlackfeetBolivianBrazilianBritishBritish West IndianBulgarianBurmeseCajunCambodianCanadianCape VerdeanCarpatho RusynCelticCentral AmericanCentral American IndianCherokeeCheyenneChickasawChileanChineseChippewaChoctawColombianColvilleComancheCosta RicanCreeCreekCroatianCrowCubanCypriotCzechCzechoslovakianDanishDelawareDominicanDutchDutch West IndianEastern EuropeanEcuadorianEgyptianEnglishEstonianEthiopianEuropeanFijianFilipinoFinnishFrenchFrench American IndianFrench CanadianGermanGerman RussianGhanaianGreekGuamanian/ChamorroGuatemalanGuyaneseHaitianHmongHonduranHopiHoumaHungarianIcelanderIndian (Asian)IndonesianInupiatIranianIraqiIrishIroquoisIsraeliItalianJamaicanJapaneseJordanianKenyanKiowaKoreanLaotianLatvianLebaneseLiberianLithuanianLumbeeLuxembourgerMacedonianMalaysianMalteseMarshalleseMenomineeMexicanMexican American IndianMongolianMoroccanNative HawaiianNavajoNepaleseNew ZealanderNicaraguanNigerianNorthern EuropeanNorwegianOkinawanOsageOttawaPaiutePakistaniPalestinianPanamanianParaguayanPennsylvania GermanPeruvianPimaPolishPortuguesePotawatomiPuebloPuerto RicanPuget Sound SalishRomanianRussianSalvadoranSamoanScandinavianScotch-IrishScottishSeminoleSenegaleseSerbianShoshoneSierra LeoneanSiouxSlavicSlovakSloveneSomaliSouth AfricanSouth AmericanSouth American IndianSoviet UnionSpaniardSpanishSpanish AmericanSpanish American IndianSri LankanSubsaharan AfricanSudaneseSwedishSwissSyrianTaiwaneseThaiTlingit-HaidaTohono O'OdhamTonganTrinidadian and TobagonianTsimshianTurkishU.S. Virgin IslanderUgandanUkrainianUruguayanUteVenezuelanVietnameseWelshWest IndianYakamaYaquiYugoslavianYumanYup'ikZimbabwean
Immigration
NonimmigrantsImmigrantsAfghanistanAfricaAlbaniaArgentinaArmeniaAsiaAustraliaAustriaBahamasBangladeshBarbadosBelarusBelgiumBelizeBoliviaBosnia and HerzegovinaBrazilBulgariaBurma/MyanmarCabo VerdeCambodiaCameroonCanadaCaribbeanCentral AmericaChileChinaColombiaCongoCosta RicaCroatiaCubaCzechoslovakiaDenmarkDominicaDominican RepublicEastern AfricaEastern AsiaEastern EuropeEcuadorEgyptEl SalvadorEnglandEritreaEthiopiaEuropeFijiFranceGermanyGhanaGreeceGrenadaGuatemalaGuyanaHaitiHondurasHong KongHungaryIndiaIndonesiaIranIraqIrelandIsraelItalyJamaicaJapanJordanKazakhstanKenyaKoreaKuwaitLaosLatin AmericaLatviaLebanonLiberiaLithuaniaMalaysiaMexicoMicronesiaMiddle AfricaMoldovaMoroccoNepalNetherlandsNicaraguaNigeriaNorth AmericaNorth MacedoniaNorthern AfricaNorthern EuropeNorwayOceaniaPakistanPanamaPeruPhilippinesPolandPortugalRomaniaRussiaSaudi ArabiaScotlandSenegalSerbiaSierra LeoneSingaporeSomaliaSouth AfricaSouth AmericaSouth Central AsiaSouth Eastern AsiaSouthern EuropeSpainSri LankaSt. Vincent and the GrenadinesSudanSwedenSwitzerlandSyriaTaiwanThailandTrinidad and TobagoTurkeyUgandaUruguayUzbekistanVenezuelaVietnamWest IndiesWestern AfricaWestern AsiaWestern EuropeYemenZaireZimbabweAzores
Immigrants from Ukraine
Race
Ancestry
AfghanAfricanAlaska NativeAlaskan AthabascanAlbanianAleutAlsatianAmericanApacheArabArapahoArgentineanArmenianAssyrian/Chaldean/SyriacAustralianAustrianBahamianBangladeshiBarbadianBasqueBelgianBelizeanBermudanBhutaneseBlackfeetBolivianBrazilianBritishBritish West IndianBulgarianBurmeseCajunCambodianCanadianCape VerdeanCarpatho RusynCelticCentral AmericanCentral American IndianCherokeeCheyenneChickasawChileanChineseChippewaChoctawColombianColvilleComancheCosta RicanCreeCreekCroatianCrowCubanCypriotCzechCzechoslovakianDanishDelawareDominicanDutchEastern EuropeanEcuadorianEgyptianEnglishEstonianEthiopianEuropeanFijianFilipinoFinnishFrenchFrench American IndianFrench CanadianGermanGerman RussianGhanaianGreekGuamanian/ChamorroGuatemalanGuyaneseHaitianHmongHonduranHopiHoumaHungarianIcelanderIndian (Asian)IndonesianInupiatIranianIraqiIrishIroquoisIsraeliItalianJamaicanJapaneseJordanianKenyanKiowaKoreanLaotianLatvianLebaneseLiberianLithuanianLumbeeLuxembourgerMacedonianMalaysianMalteseMarshalleseMenomineeMexicanMexican American IndianMongolianMoroccanNative HawaiianNavajoNepaleseNew ZealanderNicaraguanNigerianNorthern EuropeanNorwegianOkinawanOsageOttawaPaiutePakistaniPalestinianPanamanianParaguayanPennsylvania GermanPeruvianPimaPolishPortuguesePotawatomiPuebloPuerto RicanPuget Sound SalishRomanianRussianSalvadoranSamoanScandinavianScotch-IrishScottishSeminoleSenegaleseSerbianShoshoneSierra LeoneanSiouxSlavicSlovakSloveneSomaliSouth AfricanSouth AmericanSouth American IndianSoviet UnionSpaniardSpanishSpanish AmericanSpanish American IndianSri LankanSubsaharan AfricanSudaneseSwedishSwissSyrianTaiwaneseThaiTlingit-HaidaTohono O'OdhamTonganTrinidadian and TobagonianTsimshianTurkishU.S. Virgin IslanderUgandanUkrainianUruguayanUteVenezuelanVietnameseWelshWest IndianYakamaYaquiYugoslavianYumanYup'ikZimbabwean
Immigration
NonimmigrantsImmigrantsAfghanistanAfricaAlbaniaArgentinaArmeniaAsiaAustraliaAustriaBahamasBangladeshBarbadosBelarusBelgiumBelizeBoliviaBosnia and HerzegovinaBrazilBulgariaBurma/MyanmarCabo VerdeCambodiaCameroonCanadaCaribbeanCentral AmericaChileChinaColombiaCongoCosta RicaCroatiaCubaCzechoslovakiaDenmarkDominicaDominican RepublicEastern AfricaEastern AsiaEastern EuropeEcuadorEgyptEl SalvadorEnglandEritreaEthiopiaEuropeFijiFranceGermanyGhanaGreeceGrenadaGuatemalaGuyanaHaitiHondurasHong KongHungaryIndiaIndonesiaIranIraqIrelandIsraelItalyJamaicaJapanJordanKazakhstanKenyaKoreaKuwaitLaosLatin AmericaLatviaLebanonLiberiaLithuaniaMalaysiaMexicoMicronesiaMiddle AfricaMoldovaMoroccoNepalNetherlandsNicaraguaNigeriaNorth AmericaNorth MacedoniaNorthern AfricaNorthern EuropeNorwayOceaniaPakistanPanamaPeruPhilippinesPolandPortugalRomaniaRussiaSaudi ArabiaScotlandSenegalSerbiaSierra LeoneSingaporeSomaliaSouth AfricaSouth AmericaSouth Central AsiaSouth Eastern AsiaSouthern EuropeSpainSri LankaSt. Vincent and the GrenadinesSudanSwedenSwitzerlandSyriaTaiwanThailandTrinidad and TobagoTurkeyUgandaUkraineUruguayUzbekistanVenezuelaVietnamWest IndiesWestern AfricaWestern AsiaWestern EuropeYemenZaireZimbabweAzores
Householder Income Under 25 years
Income
Poverty
Unemployment
Labor Participation
Family Structure
Vehicle Availability
Education Level
Disability

Householder Income Under 25 years Comparison

Dutch West Indians

Immigrants from Ukraine

Tragic
Exceptional
$45,816
HOUSEHOLDER INCOME UNDER 25 YEARS
0.0/ 100
METRIC RATING
324th/ 347
METRIC RANK
$55,447
HOUSEHOLDER INCOME UNDER 25 YEARS
100.0/ 100
METRIC RATING
55th/ 347
METRIC RANK

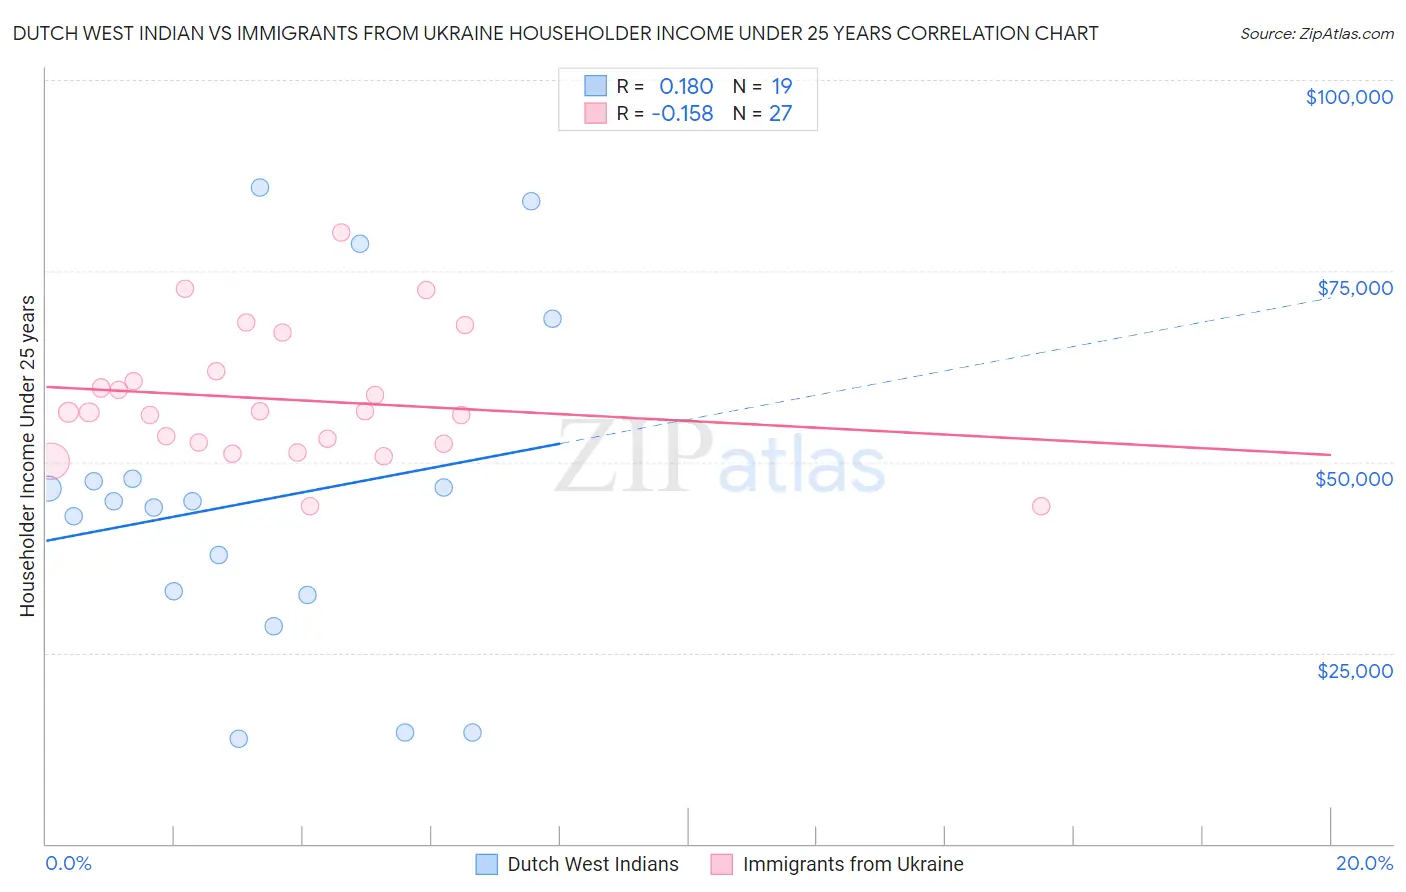
Dutch West Indian vs Immigrants from Ukraine Householder Income Under 25 years Correlation Chart

The statistical analysis conducted on geographies consisting of 80,349,978 people shows a poor positive correlation between the proportion of Dutch West Indians and household income with householder under the age of 25 in the United States with a correlation coefficient (R) of 0.180 and weighted average of $45,816. Similarly, the statistical analysis conducted on geographies consisting of 247,734,480 people shows a poor negative correlation between the proportion of Immigrants from Ukraine and household income with householder under the age of 25 in the United States with a correlation coefficient (R) of -0.158 and weighted average of $55,447, a difference of 21.0%.
Dutch West Indian vs Immigrants from Ukraine Householder Income Under 25 years

Householder Income Under 25 years Correlation Summary

MeasurementDutch West IndianImmigrants from Ukraine
Minimum$13,750$44,212
Maximum$85,865$80,041
Range$72,115$35,830
Mean$45,099$58,153
Median$44,797$56,546
Interquartile 25% (IQ1)$32,543$52,321
Interquartile 75% (IQ3)$47,825$61,864
Interquartile Range (IQR)$15,281$9,543
Standard Deviation (Sample)$21,553$8,615
Standard Deviation (Population)$20,979$8,454

Similar Demographics by Householder Income Under 25 years

Demographics Similar to Dutch West Indians by Householder Income Under 25 years

In terms of householder income under 25 years, the demographic groups most similar to Dutch West Indians are Immigrants from Bahamas ($45,793, a difference of 0.050%), Osage ($45,764, a difference of 0.11%), Bahamian ($45,743, a difference of 0.16%), German Russian ($45,673, a difference of 0.31%), and Seminole ($45,649, a difference of 0.37%).
DemographicsRating | RankHouseholder Income Under 25 years
Hopi
0.0
/100
|
#317
Tragic
$46,978
Spanish Americans
0.0
/100
|
#318
Tragic
$46,913
Africans
0.0
/100
|
#319
Tragic
$46,838
Immigrants | Sudan
0.0
/100
|
#320
Tragic
$46,791
Potawatomi
0.0
/100
|
#321
Tragic
$46,462
Sioux
0.0
/100
|
#322
Tragic
$46,417
Immigrants | Saudi Arabia
0.0
/100
|
#323
Tragic
$46,187
Dutch West Indians
0.0
/100
|
#324
Tragic
$45,816
Immigrants | Bahamas
0.0
/100
|
#325
Tragic
$45,793
Osage
0.0
/100
|
#326
Tragic
$45,764
Bahamians
0.0
/100
|
#327
Tragic
$45,743
German Russians
0.0
/100
|
#328
Tragic
$45,673
Seminole
0.0
/100
|
#329
Tragic
$45,649
Indonesians
0.0
/100
|
#330
Tragic
$45,566
Immigrants | Zaire
0.0
/100
|
#331
Tragic
$45,529

Demographics Similar to Immigrants from Ukraine by Householder Income Under 25 years

In terms of householder income under 25 years, the demographic groups most similar to Immigrants from Ukraine are Sri Lankan ($55,470, a difference of 0.040%), Immigrants from Poland ($55,474, a difference of 0.050%), Salvadoran ($55,412, a difference of 0.060%), Immigrants from Romania ($55,522, a difference of 0.13%), and Immigrants from Indonesia ($55,521, a difference of 0.13%).
DemographicsRating | RankHouseholder Income Under 25 years
Immigrants | Vietnam
100.0
/100
|
#48
Exceptional
$55,562
Iranians
100.0
/100
|
#49
Exceptional
$55,548
Puget Sound Salish
100.0
/100
|
#50
Exceptional
$55,543
Immigrants | Romania
100.0
/100
|
#51
Exceptional
$55,522
Immigrants | Indonesia
100.0
/100
|
#52
Exceptional
$55,521
Immigrants | Poland
100.0
/100
|
#53
Exceptional
$55,474
Sri Lankans
100.0
/100
|
#54
Exceptional
$55,470
Immigrants | Ukraine
100.0
/100
|
#55
Exceptional
$55,447
Salvadorans
100.0
/100
|
#56
Exceptional
$55,412
Soviet Union
100.0
/100
|
#57
Exceptional
$55,340
Guyanese
99.9
/100
|
#58
Exceptional
$55,210
Native Hawaiians
99.9
/100
|
#59
Exceptional
$55,158
Immigrants | Lithuania
99.9
/100
|
#60
Exceptional
$55,028
Immigrants | Europe
99.9
/100
|
#61
Exceptional
$55,022
Immigrants | Uzbekistan
99.8
/100
|
#62
Exceptional
$54,846