Immigrants from Denmark vs Immigrants from Ukraine Currently Married
COMPARE
Immigrants from Denmark
Immigrants from Ukraine
Currently Married
Currently Married Comparison
Immigrants from Denmark
Immigrants from Ukraine
47.6%
CURRENTLY MARRIED
90.9/ 100
METRIC RATING
113th/ 347
METRIC RANK
47.9%
CURRENTLY MARRIED
94.8/ 100
METRIC RATING
97th/ 347
METRIC RANK
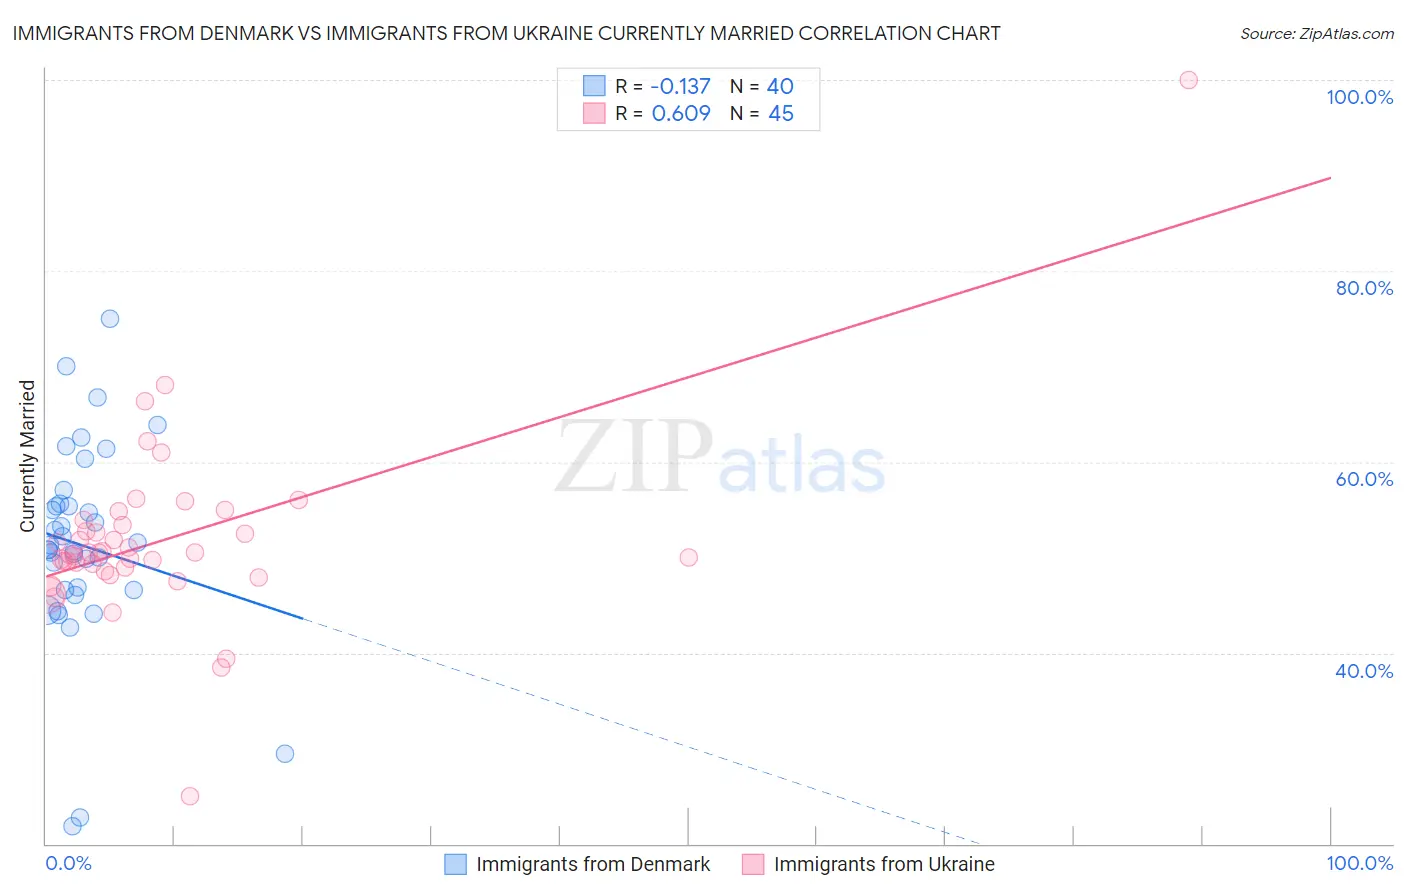
Immigrants from Denmark vs Immigrants from Ukraine Currently Married Correlation Chart
The statistical analysis conducted on geographies consisting of 136,433,385 people shows a poor negative correlation between the proportion of Immigrants from Denmark and percentage of population currently married in the United States with a correlation coefficient (R) of -0.137 and weighted average of 47.6%. Similarly, the statistical analysis conducted on geographies consisting of 289,694,818 people shows a significant positive correlation between the proportion of Immigrants from Ukraine and percentage of population currently married in the United States with a correlation coefficient (R) of 0.609 and weighted average of 47.9%, a difference of 0.54%.
Currently Married Correlation Summary
| Measurement | Immigrants from Denmark | Immigrants from Ukraine |
| Minimum | 21.8% | 25.0% |
| Maximum | 75.0% | 100.0% |
| Range | 53.2% | 75.0% |
| Mean | 51.3% | 51.9% |
| Median | 51.1% | 50.5% |
| Interquartile 25% (IQ1) | 46.6% | 48.7% |
| Interquartile 75% (IQ3) | 55.5% | 53.6% |
| Interquartile Range (IQR) | 8.9% | 4.9% |
| Standard Deviation (Sample) | 10.6% | 10.0% |
| Standard Deviation (Population) | 10.5% | 9.9% |
Demographics Similar to Immigrants from Denmark and Immigrants from Ukraine by Currently Married
In terms of currently married, the demographic groups most similar to Immigrants from Denmark are Immigrants from Western Europe (47.6%, a difference of 0.030%), South African (47.6%, a difference of 0.030%), Immigrants from Hungary (47.6%, a difference of 0.040%), Immigrants from Indonesia (47.6%, a difference of 0.040%), and Immigrants from Russia (47.7%, a difference of 0.13%). Similarly, the demographic groups most similar to Immigrants from Ukraine are Immigrants from Bulgaria (47.9%, a difference of 0.010%), Egyptian (47.9%, a difference of 0.010%), Immigrants from China (47.9%, a difference of 0.020%), Immigrants from Sweden (47.8%, a difference of 0.090%), and Celtic (47.8%, a difference of 0.11%).
| Demographics | Rating | Rank | Currently Married |
| Immigrants | Bulgaria | 94.8 /100 | #95 | Exceptional 47.9% |
| Egyptians | 94.8 /100 | #96 | Exceptional 47.9% |
| Immigrants | Ukraine | 94.8 /100 | #97 | Exceptional 47.9% |
| Immigrants | China | 94.7 /100 | #98 | Exceptional 47.9% |
| Immigrants | Sweden | 94.3 /100 | #99 | Exceptional 47.8% |
| Celtics | 94.2 /100 | #100 | Exceptional 47.8% |
| Immigrants | Germany | 94.1 /100 | #101 | Exceptional 47.8% |
| Turks | 93.9 /100 | #102 | Exceptional 47.8% |
| Cypriots | 93.7 /100 | #103 | Exceptional 47.8% |
| Serbians | 93.6 /100 | #104 | Exceptional 47.8% |
| Immigrants | Singapore | 93.3 /100 | #105 | Exceptional 47.8% |
| Immigrants | Greece | 93.1 /100 | #106 | Exceptional 47.7% |
| Immigrants | Italy | 92.9 /100 | #107 | Exceptional 47.7% |
| Tsimshian | 92.4 /100 | #108 | Exceptional 47.7% |
| Immigrants | Egypt | 92.3 /100 | #109 | Exceptional 47.7% |
| Immigrants | Russia | 92.0 /100 | #110 | Exceptional 47.7% |
| Immigrants | Hungary | 91.2 /100 | #111 | Exceptional 47.6% |
| Immigrants | Western Europe | 91.1 /100 | #112 | Exceptional 47.6% |
| Immigrants | Denmark | 90.9 /100 | #113 | Exceptional 47.6% |
| South Africans | 90.5 /100 | #114 | Exceptional 47.6% |
| Immigrants | Indonesia | 90.5 /100 | #115 | Exceptional 47.6% |