Immigrants from Portugal vs Immigrants from Caribbean Median Male Earnings
COMPARE
Immigrants from Portugal
Immigrants from Caribbean
Median Male Earnings
Median Male Earnings Comparison
Immigrants from Portugal
Immigrants from Caribbean
$55,182
MEDIAN MALE EARNINGS
66.3/ 100
METRIC RATING
165th/ 347
METRIC RANK
$46,193
MEDIAN MALE EARNINGS
0.0/ 100
METRIC RATING
316th/ 347
METRIC RANK
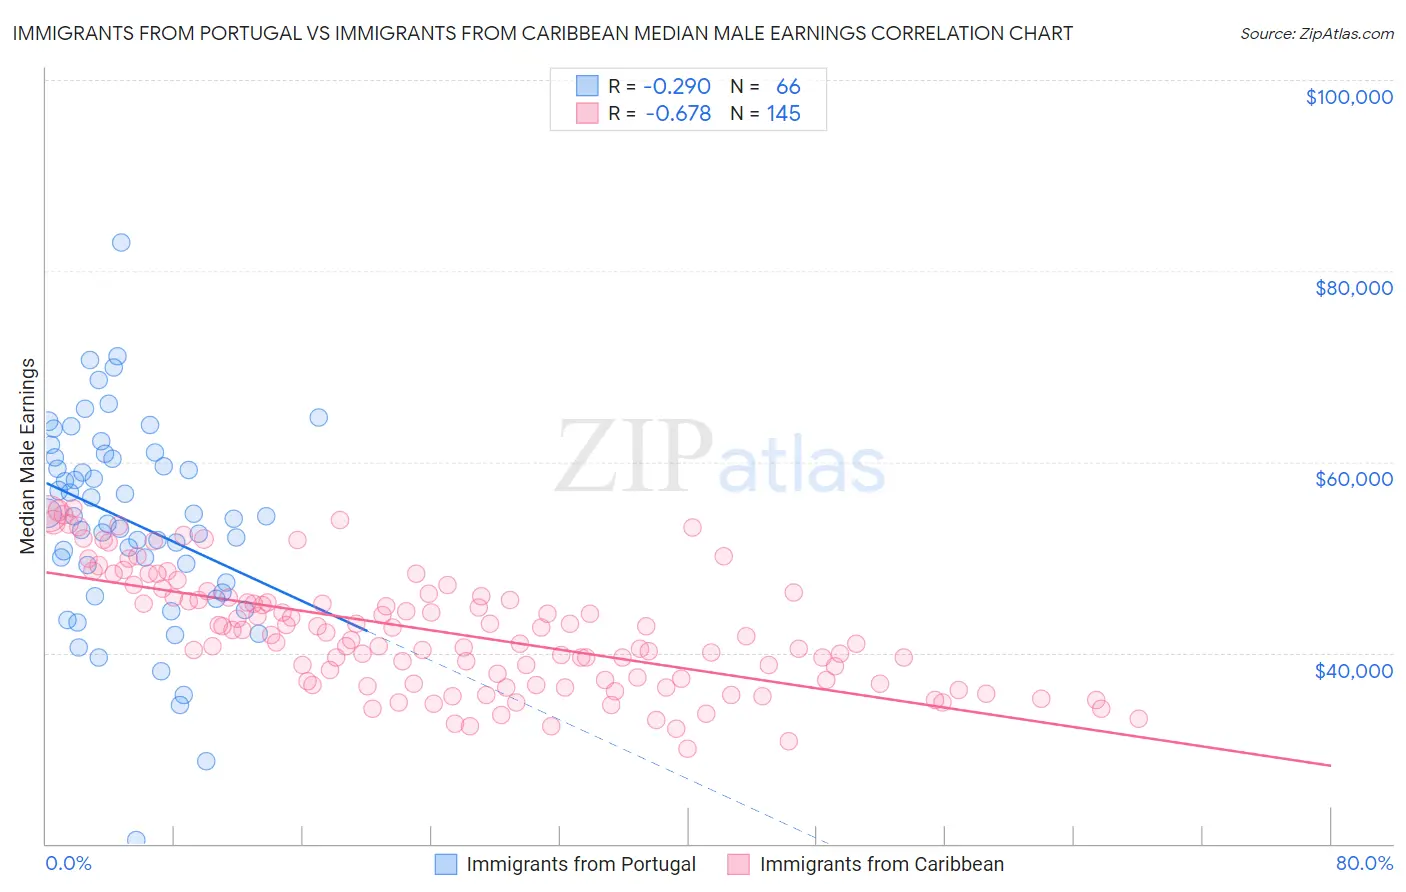
Immigrants from Portugal vs Immigrants from Caribbean Median Male Earnings Correlation Chart
The statistical analysis conducted on geographies consisting of 174,772,823 people shows a weak negative correlation between the proportion of Immigrants from Portugal and median male earnings in the United States with a correlation coefficient (R) of -0.290 and weighted average of $55,182. Similarly, the statistical analysis conducted on geographies consisting of 449,789,932 people shows a significant negative correlation between the proportion of Immigrants from Caribbean and median male earnings in the United States with a correlation coefficient (R) of -0.678 and weighted average of $46,193, a difference of 19.5%.
Median Male Earnings Correlation Summary
| Measurement | Immigrants from Portugal | Immigrants from Caribbean |
| Minimum | $20,417 | $30,010 |
| Maximum | $82,976 | $55,142 |
| Range | $62,559 | $25,132 |
| Mean | $53,702 | $42,215 |
| Median | $54,126 | $41,809 |
| Interquartile 25% (IQ1) | $47,334 | $37,054 |
| Interquartile 75% (IQ3) | $60,481 | $46,037 |
| Interquartile Range (IQR) | $13,147 | $8,984 |
| Standard Deviation (Sample) | $10,627 | $6,100 |
| Standard Deviation (Population) | $10,546 | $6,079 |
Similar Demographics by Median Male Earnings
Demographics Similar to Immigrants from Portugal by Median Male Earnings
In terms of median male earnings, the demographic groups most similar to Immigrants from Portugal are Immigrants from South Eastern Asia ($55,241, a difference of 0.11%), Ugandan ($55,290, a difference of 0.20%), French ($55,350, a difference of 0.31%), Belgian ($55,361, a difference of 0.32%), and Basque ($55,370, a difference of 0.34%).
| Demographics | Rating | Rank | Median Male Earnings |
| Czechoslovakians | 70.5 /100 | #158 | Good $55,382 |
| Alsatians | 70.5 /100 | #159 | Good $55,380 |
| Basques | 70.3 /100 | #160 | Good $55,370 |
| Belgians | 70.1 /100 | #161 | Good $55,361 |
| French | 69.9 /100 | #162 | Good $55,350 |
| Ugandans | 68.6 /100 | #163 | Good $55,290 |
| Immigrants | South Eastern Asia | 67.6 /100 | #164 | Good $55,241 |
| Immigrants | Portugal | 66.3 /100 | #165 | Good $55,182 |
| Germans | 61.6 /100 | #166 | Good $54,974 |
| Immigrants | Fiji | 61.2 /100 | #167 | Good $54,958 |
| Immigrants | Vietnam | 60.2 /100 | #168 | Good $54,913 |
| French Canadians | 55.6 /100 | #169 | Average $54,722 |
| Finns | 55.6 /100 | #170 | Average $54,721 |
| Immigrants | Peru | 54.9 /100 | #171 | Average $54,695 |
| Welsh | 53.8 /100 | #172 | Average $54,647 |
Demographics Similar to Immigrants from Caribbean by Median Male Earnings
In terms of median male earnings, the demographic groups most similar to Immigrants from Caribbean are Mexican ($46,147, a difference of 0.10%), Immigrants from Guatemala ($46,244, a difference of 0.11%), Cheyenne ($46,062, a difference of 0.28%), Chippewa ($46,368, a difference of 0.38%), and Honduran ($46,374, a difference of 0.39%).
| Demographics | Rating | Rank | Median Male Earnings |
| Creek | 0.0 /100 | #309 | Tragic $46,594 |
| Cubans | 0.0 /100 | #310 | Tragic $46,580 |
| Apache | 0.0 /100 | #311 | Tragic $46,429 |
| Hispanics or Latinos | 0.0 /100 | #312 | Tragic $46,419 |
| Hondurans | 0.0 /100 | #313 | Tragic $46,374 |
| Chippewa | 0.0 /100 | #314 | Tragic $46,368 |
| Immigrants | Guatemala | 0.0 /100 | #315 | Tragic $46,244 |
| Immigrants | Caribbean | 0.0 /100 | #316 | Tragic $46,193 |
| Mexicans | 0.0 /100 | #317 | Tragic $46,147 |
| Cheyenne | 0.0 /100 | #318 | Tragic $46,062 |
| Haitians | 0.0 /100 | #319 | Tragic $45,903 |
| Immigrants | Honduras | 0.0 /100 | #320 | Tragic $45,787 |
| Fijians | 0.0 /100 | #321 | Tragic $45,607 |
| Sioux | 0.0 /100 | #322 | Tragic $45,566 |
| Immigrants | Central America | 0.0 /100 | #323 | Tragic $45,538 |