Immigrants from Cuba vs Immigrants from Belize Disability Age 35 to 64
COMPARE
Immigrants from Cuba
Immigrants from Belize
Disability Age 35 to 64
Disability Age 35 to 64 Comparison
Immigrants from Cuba
Immigrants from Belize
9.7%
DISABILITY AGE 35 TO 64
99.9/ 100
METRIC RATING
36th/ 347
METRIC RANK
11.9%
DISABILITY AGE 35 TO 64
6.6/ 100
METRIC RATING
225th/ 347
METRIC RANK
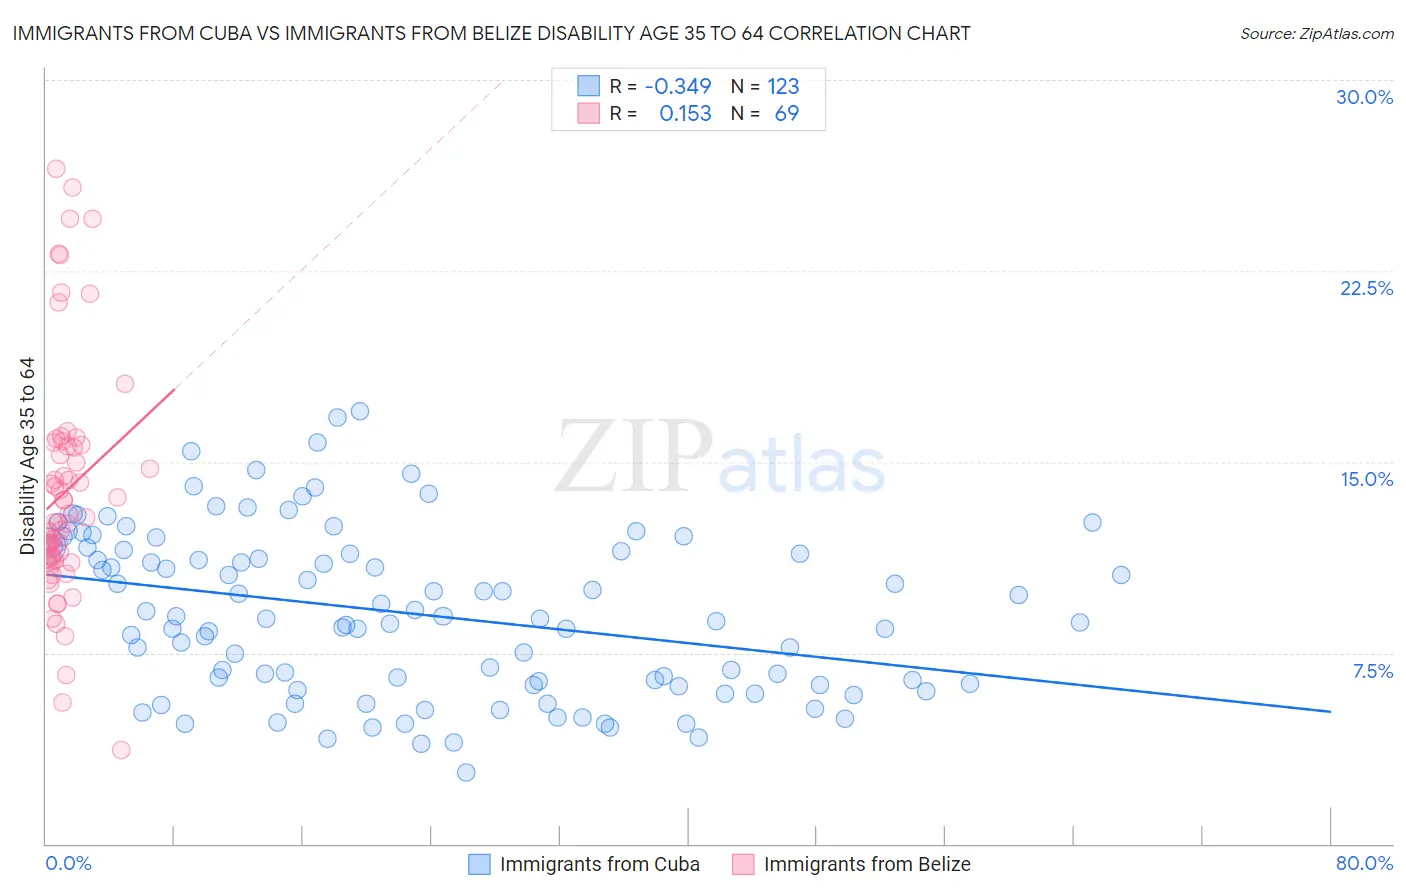
Immigrants from Cuba vs Immigrants from Belize Disability Age 35 to 64 Correlation Chart
The statistical analysis conducted on geographies consisting of 325,944,060 people shows a mild negative correlation between the proportion of Immigrants from Cuba and percentage of population with a disability between the ages 34 and 64 in the United States with a correlation coefficient (R) of -0.349 and weighted average of 9.7%. Similarly, the statistical analysis conducted on geographies consisting of 130,283,468 people shows a poor positive correlation between the proportion of Immigrants from Belize and percentage of population with a disability between the ages 34 and 64 in the United States with a correlation coefficient (R) of 0.153 and weighted average of 11.9%, a difference of 22.7%.
Disability Age 35 to 64 Correlation Summary
| Measurement | Immigrants from Cuba | Immigrants from Belize |
| Minimum | 2.8% | 3.7% |
| Maximum | 17.0% | 26.5% |
| Range | 14.2% | 22.8% |
| Mean | 9.0% | 13.8% |
| Median | 8.8% | 12.6% |
| Interquartile 25% (IQ1) | 6.2% | 11.1% |
| Interquartile 75% (IQ3) | 11.5% | 15.6% |
| Interquartile Range (IQR) | 5.3% | 4.5% |
| Standard Deviation (Sample) | 3.2% | 4.6% |
| Standard Deviation (Population) | 3.2% | 4.6% |
Similar Demographics by Disability Age 35 to 64
Demographics Similar to Immigrants from Cuba by Disability Age 35 to 64
In terms of disability age 35 to 64, the demographic groups most similar to Immigrants from Cuba are Bulgarian (9.7%, a difference of 0.040%), Immigrants from Turkey (9.7%, a difference of 0.080%), Immigrants from Australia (9.7%, a difference of 0.14%), Egyptian (9.7%, a difference of 0.15%), and Immigrants from Indonesia (9.7%, a difference of 0.21%).
| Demographics | Rating | Rank | Disability Age 35 to 64 |
| Immigrants | Ireland | 100.0 /100 | #29 | Exceptional 9.5% |
| Immigrants | Japan | 100.0 /100 | #30 | Exceptional 9.5% |
| Immigrants | Lithuania | 99.9 /100 | #31 | Exceptional 9.6% |
| Turks | 99.9 /100 | #32 | Exceptional 9.7% |
| Immigrants | Indonesia | 99.9 /100 | #33 | Exceptional 9.7% |
| Immigrants | Australia | 99.9 /100 | #34 | Exceptional 9.7% |
| Bulgarians | 99.9 /100 | #35 | Exceptional 9.7% |
| Immigrants | Cuba | 99.9 /100 | #36 | Exceptional 9.7% |
| Immigrants | Turkey | 99.9 /100 | #37 | Exceptional 9.7% |
| Egyptians | 99.9 /100 | #38 | Exceptional 9.7% |
| Immigrants | Belarus | 99.9 /100 | #39 | Exceptional 9.7% |
| Immigrants | Armenia | 99.9 /100 | #40 | Exceptional 9.7% |
| Israelis | 99.9 /100 | #41 | Exceptional 9.7% |
| Immigrants | Malaysia | 99.9 /100 | #42 | Exceptional 9.7% |
| Immigrants | Colombia | 99.9 /100 | #43 | Exceptional 9.8% |
Demographics Similar to Immigrants from Belize by Disability Age 35 to 64
In terms of disability age 35 to 64, the demographic groups most similar to Immigrants from Belize are Scandinavian (11.9%, a difference of 0.080%), Immigrants from Central America (11.9%, a difference of 0.11%), Immigrants from Germany (11.9%, a difference of 0.14%), British West Indian (11.9%, a difference of 0.17%), and Panamanian (11.9%, a difference of 0.27%).
| Demographics | Rating | Rank | Disability Age 35 to 64 |
| Immigrants | Bahamas | 9.2 /100 | #218 | Tragic 11.8% |
| Czechoslovakians | 9.0 /100 | #219 | Tragic 11.8% |
| Immigrants | West Indies | 8.9 /100 | #220 | Tragic 11.8% |
| Alsatians | 8.5 /100 | #221 | Tragic 11.8% |
| Hondurans | 8.4 /100 | #222 | Tragic 11.8% |
| Immigrants | Honduras | 8.4 /100 | #223 | Tragic 11.8% |
| Immigrants | Ghana | 7.8 /100 | #224 | Tragic 11.8% |
| Immigrants | Belize | 6.6 /100 | #225 | Tragic 11.9% |
| Scandinavians | 6.4 /100 | #226 | Tragic 11.9% |
| Immigrants | Central America | 6.3 /100 | #227 | Tragic 11.9% |
| Immigrants | Germany | 6.2 /100 | #228 | Tragic 11.9% |
| British West Indians | 6.1 /100 | #229 | Tragic 11.9% |
| Panamanians | 5.8 /100 | #230 | Tragic 11.9% |
| Jamaicans | 5.7 /100 | #231 | Tragic 11.9% |
| Sudanese | 5.3 /100 | #232 | Tragic 11.9% |