Immigrants from Cuba vs Nigerian Per Capita Income
COMPARE
Immigrants from Cuba
Nigerian
Per Capita Income
Per Capita Income Comparison
Immigrants from Cuba
Nigerians
$34,910
PER CAPITA INCOME
0.0/ 100
METRIC RATING
326th/ 347
METRIC RANK
$41,026
PER CAPITA INCOME
4.9/ 100
METRIC RATING
229th/ 347
METRIC RANK
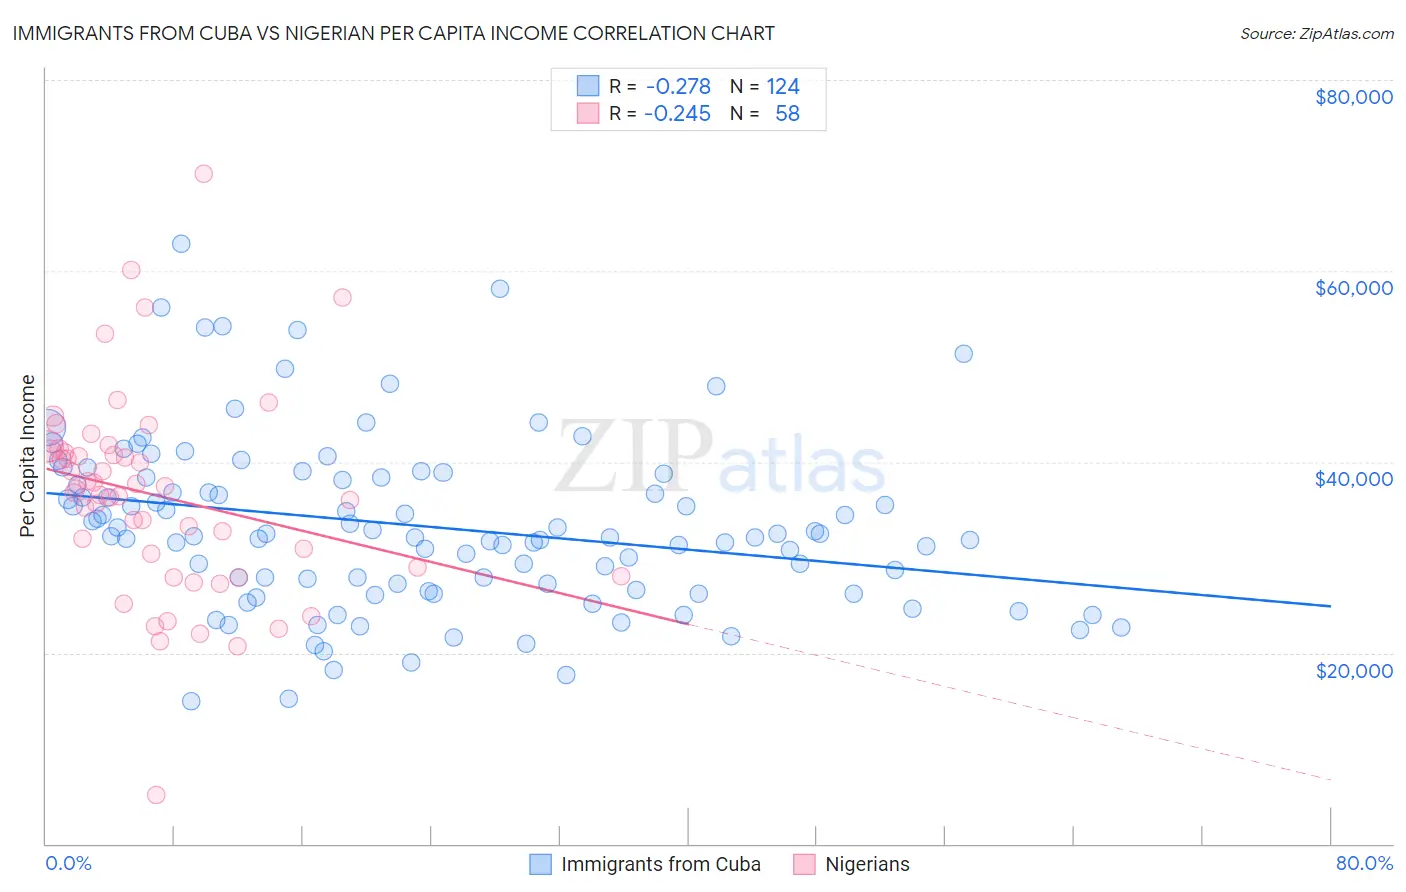
Immigrants from Cuba vs Nigerian Per Capita Income Correlation Chart
The statistical analysis conducted on geographies consisting of 325,884,272 people shows a weak negative correlation between the proportion of Immigrants from Cuba and per capita income in the United States with a correlation coefficient (R) of -0.278 and weighted average of $34,910. Similarly, the statistical analysis conducted on geographies consisting of 332,796,588 people shows a weak negative correlation between the proportion of Nigerians and per capita income in the United States with a correlation coefficient (R) of -0.245 and weighted average of $41,026, a difference of 17.5%.
Per Capita Income Correlation Summary
| Measurement | Immigrants from Cuba | Nigerian |
| Minimum | $14,936 | $5,085 |
| Maximum | $62,804 | $70,186 |
| Range | $47,868 | $65,101 |
| Mean | $33,273 | $36,468 |
| Median | $32,226 | $37,024 |
| Interquartile 25% (IQ1) | $26,888 | $28,928 |
| Interquartile 75% (IQ3) | $38,343 | $41,176 |
| Interquartile Range (IQR) | $11,455 | $12,248 |
| Standard Deviation (Sample) | $9,025 | $10,721 |
| Standard Deviation (Population) | $8,989 | $10,628 |
Similar Demographics by Per Capita Income
Demographics Similar to Immigrants from Cuba by Per Capita Income
In terms of per capita income, the demographic groups most similar to Immigrants from Cuba are Apache ($34,886, a difference of 0.070%), Immigrants from Central America ($34,974, a difference of 0.18%), Kiowa ($35,102, a difference of 0.55%), Menominee ($34,578, a difference of 0.96%), and Mexican ($34,559, a difference of 1.0%).
| Demographics | Rating | Rank | Per Capita Income |
| Immigrants | Congo | 0.0 /100 | #319 | Tragic $35,720 |
| Hispanics or Latinos | 0.0 /100 | #320 | Tragic $35,688 |
| Blacks/African Americans | 0.0 /100 | #321 | Tragic $35,564 |
| Creek | 0.0 /100 | #322 | Tragic $35,546 |
| Cheyenne | 0.0 /100 | #323 | Tragic $35,276 |
| Kiowa | 0.0 /100 | #324 | Tragic $35,102 |
| Immigrants | Central America | 0.0 /100 | #325 | Tragic $34,974 |
| Immigrants | Cuba | 0.0 /100 | #326 | Tragic $34,910 |
| Apache | 0.0 /100 | #327 | Tragic $34,886 |
| Menominee | 0.0 /100 | #328 | Tragic $34,578 |
| Mexicans | 0.0 /100 | #329 | Tragic $34,559 |
| Spanish American Indians | 0.0 /100 | #330 | Tragic $34,195 |
| Immigrants | Mexico | 0.0 /100 | #331 | Tragic $33,931 |
| Sioux | 0.0 /100 | #332 | Tragic $33,921 |
| Immigrants | Yemen | 0.0 /100 | #333 | Tragic $33,696 |
Demographics Similar to Nigerians by Per Capita Income
In terms of per capita income, the demographic groups most similar to Nigerians are Native Hawaiian ($41,017, a difference of 0.020%), Senegalese ($41,000, a difference of 0.060%), Guyanese ($40,949, a difference of 0.19%), Immigrants from Grenada ($41,123, a difference of 0.24%), and Immigrants from Ghana ($41,131, a difference of 0.26%).
| Demographics | Rating | Rank | Per Capita Income |
| Immigrants | Iraq | 7.1 /100 | #222 | Tragic $41,365 |
| Immigrants | Cameroon | 6.8 /100 | #223 | Tragic $41,334 |
| Immigrants | St. Vincent and the Grenadines | 6.4 /100 | #224 | Tragic $41,270 |
| West Indians | 6.0 /100 | #225 | Tragic $41,217 |
| Immigrants | Ecuador | 5.9 /100 | #226 | Tragic $41,195 |
| Immigrants | Ghana | 5.5 /100 | #227 | Tragic $41,131 |
| Immigrants | Grenada | 5.5 /100 | #228 | Tragic $41,123 |
| Nigerians | 4.9 /100 | #229 | Tragic $41,026 |
| Native Hawaiians | 4.9 /100 | #230 | Tragic $41,017 |
| Senegalese | 4.8 /100 | #231 | Tragic $41,000 |
| Guyanese | 4.5 /100 | #232 | Tragic $40,949 |
| Delaware | 3.8 /100 | #233 | Tragic $40,778 |
| Immigrants | West Indies | 3.7 /100 | #234 | Tragic $40,763 |
| Immigrants | Guyana | 3.6 /100 | #235 | Tragic $40,742 |
| Immigrants | Nonimmigrants | 3.4 /100 | #236 | Tragic $40,669 |