Immigrants from Croatia vs Serbian Wage/Income Gap
COMPARE
Immigrants from Croatia
Serbian
Wage/Income Gap
Wage/Income Gap Comparison
Immigrants from Croatia
Serbians
26.2%
WAGE/INCOME GAP
24.8/ 100
METRIC RATING
190th/ 347
METRIC RANK
27.7%
WAGE/INCOME GAP
1.0/ 100
METRIC RATING
265th/ 347
METRIC RANK
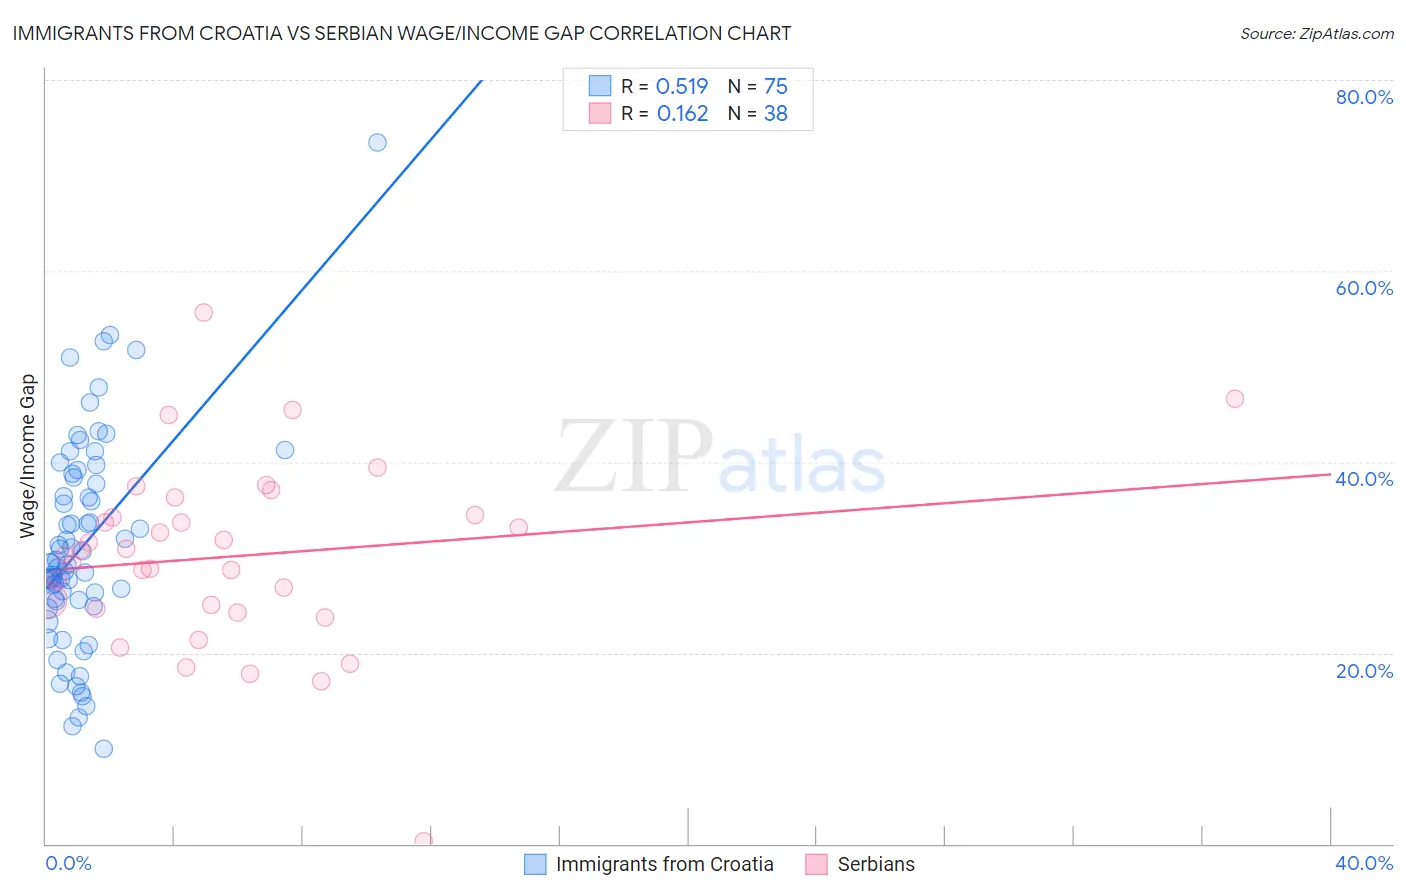
Immigrants from Croatia vs Serbian Wage/Income Gap Correlation Chart
The statistical analysis conducted on geographies consisting of 132,560,364 people shows a substantial positive correlation between the proportion of Immigrants from Croatia and wage/income gap percentage in the United States with a correlation coefficient (R) of 0.519 and weighted average of 26.2%. Similarly, the statistical analysis conducted on geographies consisting of 267,552,090 people shows a poor positive correlation between the proportion of Serbians and wage/income gap percentage in the United States with a correlation coefficient (R) of 0.162 and weighted average of 27.7%, a difference of 5.6%.
Wage/Income Gap Correlation Summary
| Measurement | Immigrants from Croatia | Serbian |
| Minimum | 10.0% | 0.33% |
| Maximum | 73.5% | 55.6% |
| Range | 63.5% | 55.3% |
| Mean | 31.2% | 30.1% |
| Median | 29.4% | 30.5% |
| Interquartile 25% (IQ1) | 25.4% | 24.6% |
| Interquartile 75% (IQ3) | 38.4% | 34.5% |
| Interquartile Range (IQR) | 13.0% | 9.9% |
| Standard Deviation (Sample) | 11.1% | 9.8% |
| Standard Deviation (Population) | 11.0% | 9.7% |
Similar Demographics by Wage/Income Gap
Demographics Similar to Immigrants from Croatia by Wage/Income Gap
In terms of wage/income gap, the demographic groups most similar to Immigrants from Croatia are Immigrants from Venezuela (26.2%, a difference of 0.020%), Immigrants from Moldova (26.2%, a difference of 0.15%), Immigrants from Bulgaria (26.3%, a difference of 0.20%), Immigrants from Jordan (26.3%, a difference of 0.22%), and Chilean (26.3%, a difference of 0.22%).
| Demographics | Rating | Rank | Wage/Income Gap |
| Immigrants | Kazakhstan | 35.2 /100 | #183 | Fair 26.0% |
| Mexicans | 34.4 /100 | #184 | Fair 26.0% |
| Pakistanis | 33.7 /100 | #185 | Fair 26.1% |
| Immigrants | Indonesia | 32.5 /100 | #186 | Fair 26.1% |
| Palestinians | 29.9 /100 | #187 | Fair 26.1% |
| Immigrants | Egypt | 29.9 /100 | #188 | Fair 26.1% |
| Immigrants | Moldova | 26.6 /100 | #189 | Fair 26.2% |
| Immigrants | Croatia | 24.8 /100 | #190 | Fair 26.2% |
| Immigrants | Venezuela | 24.7 /100 | #191 | Fair 26.2% |
| Immigrants | Bulgaria | 22.5 /100 | #192 | Fair 26.3% |
| Immigrants | Jordan | 22.4 /100 | #193 | Fair 26.3% |
| Chileans | 22.3 /100 | #194 | Fair 26.3% |
| Immigrants | Malaysia | 22.2 /100 | #195 | Fair 26.3% |
| Immigrants | Western Asia | 21.7 /100 | #196 | Fair 26.3% |
| Zimbabweans | 21.6 /100 | #197 | Fair 26.3% |
Demographics Similar to Serbians by Wage/Income Gap
In terms of wage/income gap, the demographic groups most similar to Serbians are Immigrants from Switzerland (27.7%, a difference of 0.0%), Hmong (27.7%, a difference of 0.0%), Turkish (27.7%, a difference of 0.020%), New Zealander (27.7%, a difference of 0.10%), and Potawatomi (27.7%, a difference of 0.11%).
| Demographics | Rating | Rank | Wage/Income Gap |
| Slavs | 1.8 /100 | #258 | Tragic 27.4% |
| Icelanders | 1.8 /100 | #259 | Tragic 27.5% |
| Tongans | 1.7 /100 | #260 | Tragic 27.5% |
| Immigrants | Germany | 1.5 /100 | #261 | Tragic 27.5% |
| Immigrants | Lebanon | 1.5 /100 | #262 | Tragic 27.5% |
| Syrians | 1.4 /100 | #263 | Tragic 27.6% |
| Immigrants | Switzerland | 1.0 /100 | #264 | Tragic 27.7% |
| Serbians | 1.0 /100 | #265 | Tragic 27.7% |
| Hmong | 1.0 /100 | #266 | Tragic 27.7% |
| Turks | 1.0 /100 | #267 | Tragic 27.7% |
| New Zealanders | 1.0 /100 | #268 | Tragic 27.7% |
| Potawatomi | 0.9 /100 | #269 | Tragic 27.7% |
| Immigrants | Western Europe | 0.9 /100 | #270 | Tragic 27.8% |
| Ute | 0.8 /100 | #271 | Tragic 27.8% |
| Immigrants | Korea | 0.8 /100 | #272 | Tragic 27.8% |