Immigrants from Croatia vs Sierra Leonean Median Female Earnings
COMPARE
Immigrants from Croatia
Sierra Leonean
Median Female Earnings
Median Female Earnings Comparison
Immigrants from Croatia
Sierra Leoneans
$43,258
MEDIAN FEMALE EARNINGS
99.9/ 100
METRIC RATING
56th/ 347
METRIC RANK
$42,868
MEDIAN FEMALE EARNINGS
99.9/ 100
METRIC RATING
65th/ 347
METRIC RANK
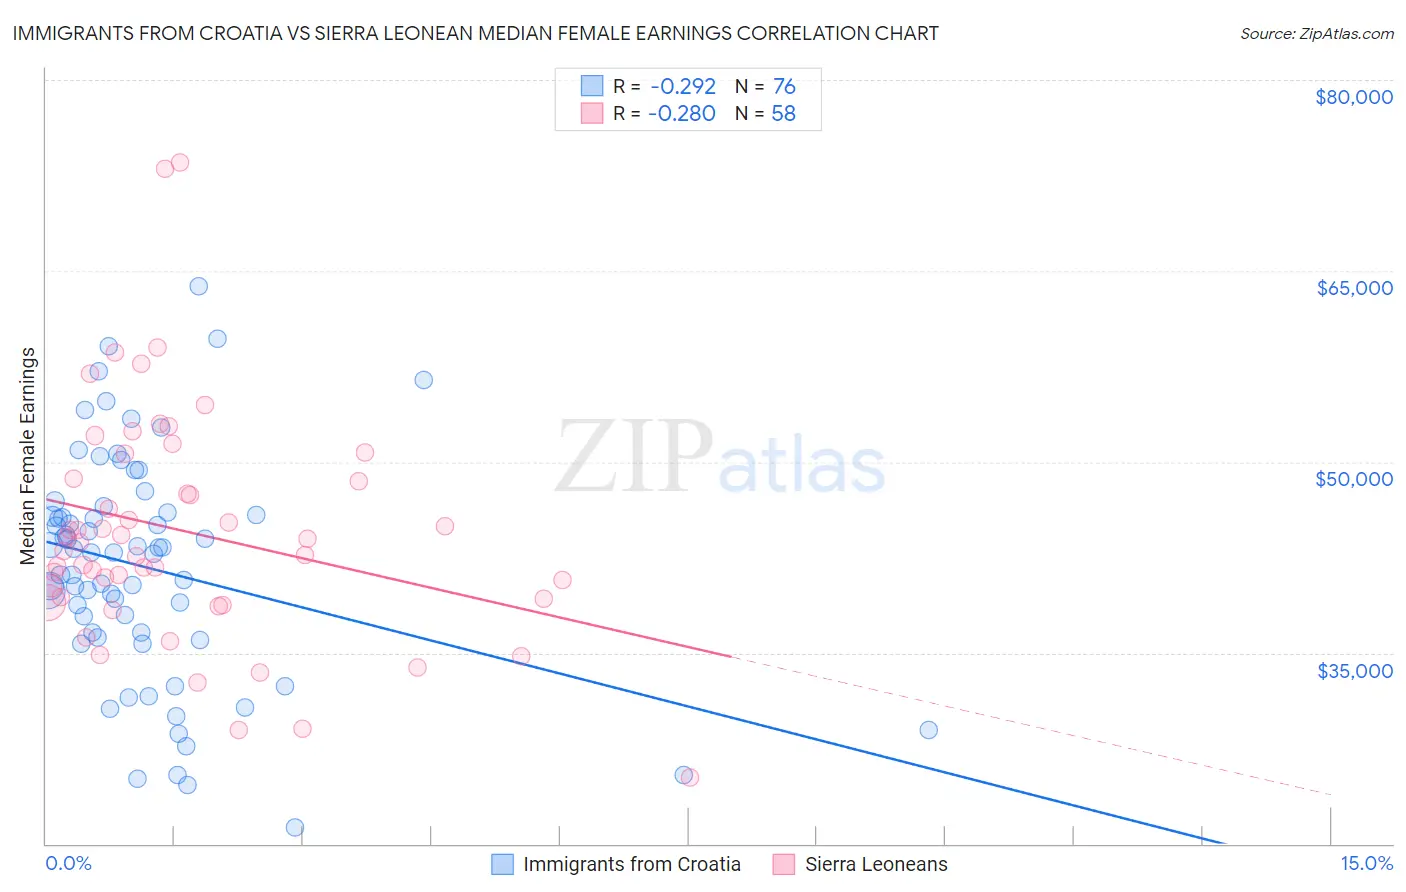
Immigrants from Croatia vs Sierra Leonean Median Female Earnings Correlation Chart
The statistical analysis conducted on geographies consisting of 132,568,368 people shows a weak negative correlation between the proportion of Immigrants from Croatia and median female earnings in the United States with a correlation coefficient (R) of -0.292 and weighted average of $43,258. Similarly, the statistical analysis conducted on geographies consisting of 83,345,835 people shows a weak negative correlation between the proportion of Sierra Leoneans and median female earnings in the United States with a correlation coefficient (R) of -0.280 and weighted average of $42,868, a difference of 0.91%.
Median Female Earnings Correlation Summary
| Measurement | Immigrants from Croatia | Sierra Leonean |
| Minimum | $21,250 | $25,167 |
| Maximum | $63,753 | $73,523 |
| Range | $42,503 | $48,356 |
| Mean | $41,680 | $44,483 |
| Median | $42,916 | $43,304 |
| Interquartile 25% (IQ1) | $36,403 | $39,290 |
| Interquartile 75% (IQ3) | $45,910 | $48,705 |
| Interquartile Range (IQR) | $9,507 | $9,415 |
| Standard Deviation (Sample) | $8,879 | $9,174 |
| Standard Deviation (Population) | $8,820 | $9,094 |
Demographics Similar to Immigrants from Croatia and Sierra Leoneans by Median Female Earnings
In terms of median female earnings, the demographic groups most similar to Immigrants from Croatia are Ethiopian ($43,243, a difference of 0.040%), Australian ($43,308, a difference of 0.11%), Egyptian ($43,305, a difference of 0.11%), Immigrants from Eastern Europe ($43,309, a difference of 0.12%), and Immigrants from Lithuania ($43,317, a difference of 0.14%). Similarly, the demographic groups most similar to Sierra Leoneans are Immigrants from Norway ($42,837, a difference of 0.070%), Immigrants from Egypt ($42,837, a difference of 0.070%), Immigrants from Austria ($42,824, a difference of 0.10%), Immigrants from Spain ($42,815, a difference of 0.12%), and Immigrants from Ethiopia ($42,744, a difference of 0.29%).
| Demographics | Rating | Rank | Median Female Earnings |
| Immigrants | Uzbekistan | 100.0 /100 | #50 | Exceptional $43,363 |
| Maltese | 100.0 /100 | #51 | Exceptional $43,357 |
| Immigrants | Lithuania | 99.9 /100 | #52 | Exceptional $43,317 |
| Immigrants | Eastern Europe | 99.9 /100 | #53 | Exceptional $43,309 |
| Australians | 99.9 /100 | #54 | Exceptional $43,308 |
| Egyptians | 99.9 /100 | #55 | Exceptional $43,305 |
| Immigrants | Croatia | 99.9 /100 | #56 | Exceptional $43,258 |
| Ethiopians | 99.9 /100 | #57 | Exceptional $43,243 |
| Paraguayans | 99.9 /100 | #58 | Exceptional $43,173 |
| Estonians | 99.9 /100 | #59 | Exceptional $43,106 |
| Immigrants | Latvia | 99.9 /100 | #60 | Exceptional $43,099 |
| Immigrants | Bulgaria | 99.9 /100 | #61 | Exceptional $43,085 |
| Afghans | 99.9 /100 | #62 | Exceptional $43,077 |
| Immigrants | Ukraine | 99.9 /100 | #63 | Exceptional $43,069 |
| Immigrants | Pakistan | 99.9 /100 | #64 | Exceptional $43,052 |
| Sierra Leoneans | 99.9 /100 | #65 | Exceptional $42,868 |
| Immigrants | Norway | 99.9 /100 | #66 | Exceptional $42,837 |
| Immigrants | Egypt | 99.9 /100 | #67 | Exceptional $42,837 |
| Immigrants | Austria | 99.8 /100 | #68 | Exceptional $42,824 |
| Immigrants | Spain | 99.8 /100 | #69 | Exceptional $42,815 |
| Immigrants | Ethiopia | 99.8 /100 | #70 | Exceptional $42,744 |