Immigrants from Congo vs Inupiat Single Mother Households
COMPARE
Immigrants from Congo
Inupiat
Single Mother Households
Single Mother Households Comparison
Immigrants from Congo
Inupiat
8.1%
SINGLE MOTHER HOUSEHOLDS
0.0/ 100
METRIC RATING
311th/ 347
METRIC RANK
8.5%
SINGLE MOTHER HOUSEHOLDS
0.0/ 100
METRIC RATING
330th/ 347
METRIC RANK
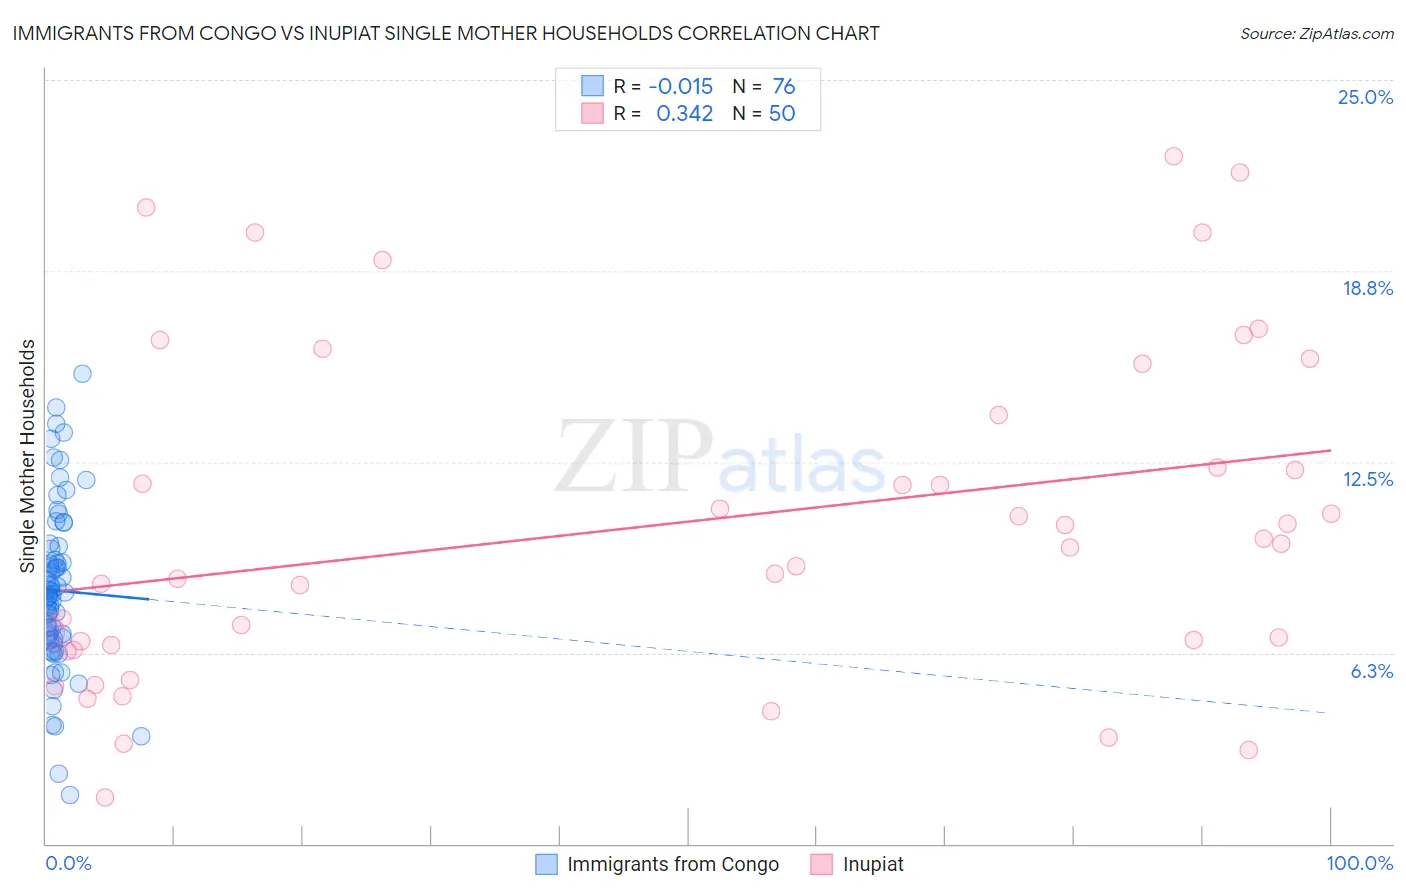
Immigrants from Congo vs Inupiat Single Mother Households Correlation Chart
The statistical analysis conducted on geographies consisting of 92,069,914 people shows no correlation between the proportion of Immigrants from Congo and percentage of single mother households in the United States with a correlation coefficient (R) of -0.015 and weighted average of 8.1%. Similarly, the statistical analysis conducted on geographies consisting of 96,271,599 people shows a mild positive correlation between the proportion of Inupiat and percentage of single mother households in the United States with a correlation coefficient (R) of 0.342 and weighted average of 8.5%, a difference of 4.5%.
Single Mother Households Correlation Summary
| Measurement | Immigrants from Congo | Inupiat |
| Minimum | 1.6% | 1.5% |
| Maximum | 15.4% | 22.5% |
| Range | 13.8% | 21.0% |
| Mean | 8.3% | 10.5% |
| Median | 8.2% | 9.7% |
| Interquartile 25% (IQ1) | 6.7% | 6.5% |
| Interquartile 75% (IQ3) | 9.5% | 14.0% |
| Interquartile Range (IQR) | 2.7% | 7.5% |
| Standard Deviation (Sample) | 2.7% | 5.4% |
| Standard Deviation (Population) | 2.7% | 5.4% |
Demographics Similar to Immigrants from Congo and Inupiat by Single Mother Households
In terms of single mother households, the demographic groups most similar to Immigrants from Congo are Honduran (8.1%, a difference of 0.29%), Bangladeshi (8.1%, a difference of 0.29%), Immigrants from Grenada (8.2%, a difference of 0.45%), Immigrants from Mexico (8.2%, a difference of 0.57%), and Immigrants from Western Africa (8.2%, a difference of 0.60%). Similarly, the demographic groups most similar to Inupiat are Hopi (8.5%, a difference of 0.11%), Yakama (8.4%, a difference of 0.85%), Immigrants from Haiti (8.4%, a difference of 1.0%), British West Indian (8.4%, a difference of 1.2%), and Immigrants from Caribbean (8.4%, a difference of 1.3%).
| Demographics | Rating | Rank | Single Mother Households |
| Hondurans | 0.0 /100 | #310 | Tragic 8.1% |
| Immigrants | Congo | 0.0 /100 | #311 | Tragic 8.1% |
| Bangladeshis | 0.0 /100 | #312 | Tragic 8.1% |
| Immigrants | Grenada | 0.0 /100 | #313 | Tragic 8.2% |
| Immigrants | Mexico | 0.0 /100 | #314 | Tragic 8.2% |
| Immigrants | Western Africa | 0.0 /100 | #315 | Tragic 8.2% |
| Africans | 0.0 /100 | #316 | Tragic 8.2% |
| Immigrants | Honduras | 0.0 /100 | #317 | Tragic 8.2% |
| Senegalese | 0.0 /100 | #318 | Tragic 8.2% |
| Jamaicans | 0.0 /100 | #319 | Tragic 8.2% |
| Bahamians | 0.0 /100 | #320 | Tragic 8.3% |
| Immigrants | Senegal | 0.0 /100 | #321 | Tragic 8.3% |
| Pima | 0.0 /100 | #322 | Tragic 8.3% |
| Haitians | 0.0 /100 | #323 | Tragic 8.3% |
| Immigrants | Jamaica | 0.0 /100 | #324 | Tragic 8.4% |
| Immigrants | Caribbean | 0.0 /100 | #325 | Tragic 8.4% |
| British West Indians | 0.0 /100 | #326 | Tragic 8.4% |
| Immigrants | Haiti | 0.0 /100 | #327 | Tragic 8.4% |
| Yakama | 0.0 /100 | #328 | Tragic 8.4% |
| Hopi | 0.0 /100 | #329 | Tragic 8.5% |
| Inupiat | 0.0 /100 | #330 | Tragic 8.5% |