Venezuelan vs Honduran Median Family Income
COMPARE
Venezuelan
Honduran
Median Family Income
Median Family Income Comparison
Venezuelans
Hondurans
$96,281
MEDIAN FAMILY INCOME
3.7/ 100
METRIC RATING
223rd/ 347
METRIC RANK
$85,004
MEDIAN FAMILY INCOME
0.0/ 100
METRIC RATING
311th/ 347
METRIC RANK
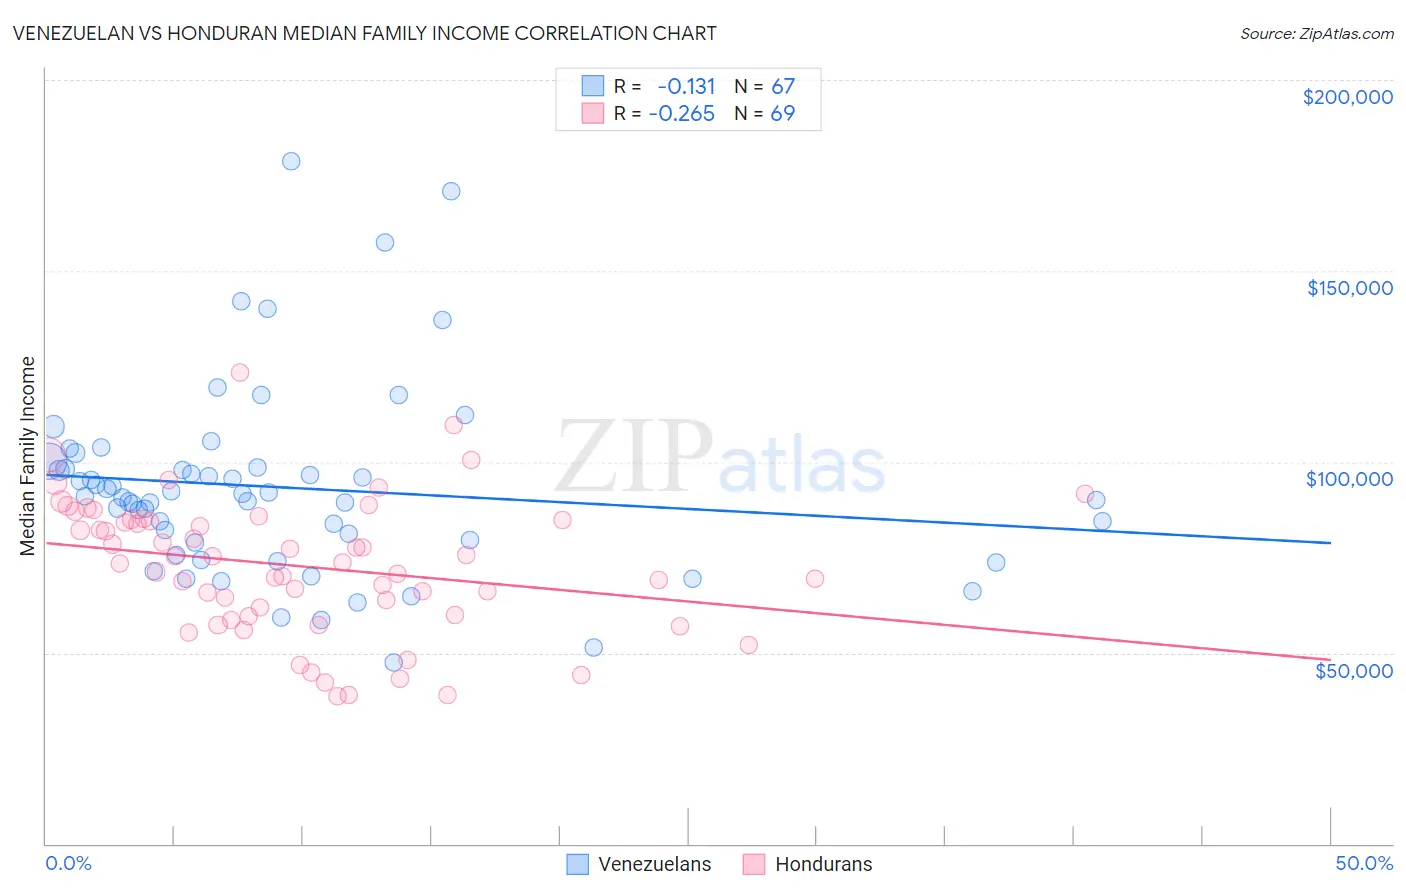
Venezuelan vs Honduran Median Family Income Correlation Chart
The statistical analysis conducted on geographies consisting of 306,049,967 people shows a poor negative correlation between the proportion of Venezuelans and median family income in the United States with a correlation coefficient (R) of -0.131 and weighted average of $96,281. Similarly, the statistical analysis conducted on geographies consisting of 357,506,155 people shows a weak negative correlation between the proportion of Hondurans and median family income in the United States with a correlation coefficient (R) of -0.265 and weighted average of $85,004, a difference of 13.3%.
Median Family Income Correlation Summary
| Measurement | Venezuelan | Honduran |
| Minimum | $47,465 | $38,552 |
| Maximum | $178,821 | $123,311 |
| Range | $131,356 | $84,759 |
| Mean | $93,300 | $72,692 |
| Median | $91,055 | $73,540 |
| Interquartile 25% (IQ1) | $78,904 | $59,714 |
| Interquartile 75% (IQ3) | $98,659 | $84,854 |
| Interquartile Range (IQR) | $19,755 | $25,140 |
| Standard Deviation (Sample) | $24,946 | $17,679 |
| Standard Deviation (Population) | $24,759 | $17,550 |
Similar Demographics by Median Family Income
Demographics Similar to Venezuelans by Median Family Income
In terms of median family income, the demographic groups most similar to Venezuelans are Nonimmigrants ($96,231, a difference of 0.050%), Immigrants from Nigeria ($96,439, a difference of 0.16%), Vietnamese ($96,123, a difference of 0.16%), Immigrants from Ghana ($96,544, a difference of 0.27%), and Sudanese ($96,783, a difference of 0.52%).
| Demographics | Rating | Rank | Median Family Income |
| Immigrants | Bosnia and Herzegovina | 6.4 /100 | #216 | Tragic $97,432 |
| Japanese | 6.0 /100 | #217 | Tragic $97,288 |
| Immigrants | Cambodia | 5.8 /100 | #218 | Tragic $97,222 |
| Delaware | 5.1 /100 | #219 | Tragic $96,958 |
| Sudanese | 4.7 /100 | #220 | Tragic $96,783 |
| Immigrants | Ghana | 4.2 /100 | #221 | Tragic $96,544 |
| Immigrants | Nigeria | 4.0 /100 | #222 | Tragic $96,439 |
| Venezuelans | 3.7 /100 | #223 | Tragic $96,281 |
| Immigrants | Nonimmigrants | 3.6 /100 | #224 | Tragic $96,231 |
| Vietnamese | 3.4 /100 | #225 | Tragic $96,123 |
| Immigrants | Panama | 2.7 /100 | #226 | Tragic $95,647 |
| Alaska Natives | 2.6 /100 | #227 | Tragic $95,573 |
| Immigrants | Azores | 2.4 /100 | #228 | Tragic $95,402 |
| Marshallese | 2.2 /100 | #229 | Tragic $95,293 |
| Malaysians | 2.2 /100 | #230 | Tragic $95,230 |
Demographics Similar to Hondurans by Median Family Income
In terms of median family income, the demographic groups most similar to Hondurans are Cuban ($84,981, a difference of 0.030%), Immigrants from Central America ($85,050, a difference of 0.050%), Choctaw ($84,835, a difference of 0.20%), Haitian ($85,218, a difference of 0.25%), and Immigrants from Bahamas ($84,732, a difference of 0.32%).
| Demographics | Rating | Rank | Median Family Income |
| Mexicans | 0.0 /100 | #304 | Tragic $85,618 |
| Paiute | 0.0 /100 | #305 | Tragic $85,414 |
| Immigrants | Dominica | 0.0 /100 | #306 | Tragic $85,411 |
| Chickasaw | 0.0 /100 | #307 | Tragic $85,356 |
| U.S. Virgin Islanders | 0.0 /100 | #308 | Tragic $85,294 |
| Haitians | 0.0 /100 | #309 | Tragic $85,218 |
| Immigrants | Central America | 0.0 /100 | #310 | Tragic $85,050 |
| Hondurans | 0.0 /100 | #311 | Tragic $85,004 |
| Cubans | 0.0 /100 | #312 | Tragic $84,981 |
| Choctaw | 0.0 /100 | #313 | Tragic $84,835 |
| Immigrants | Bahamas | 0.0 /100 | #314 | Tragic $84,732 |
| Apache | 0.0 /100 | #315 | Tragic $84,451 |
| Immigrants | Haiti | 0.0 /100 | #316 | Tragic $84,018 |
| Yakama | 0.0 /100 | #317 | Tragic $83,932 |
| Immigrants | Mexico | 0.0 /100 | #318 | Tragic $83,639 |