Immigrants from Colombia vs Spaniard Householder Income Over 65 years
COMPARE
Immigrants from Colombia
Spaniard
Householder Income Over 65 years
Householder Income Over 65 years Comparison
Immigrants from Colombia
Spaniards
$57,658
HOUSEHOLDER INCOME OVER 65 YEARS
3.0/ 100
METRIC RATING
229th/ 347
METRIC RANK
$60,866
HOUSEHOLDER INCOME OVER 65 YEARS
47.3/ 100
METRIC RATING
175th/ 347
METRIC RANK
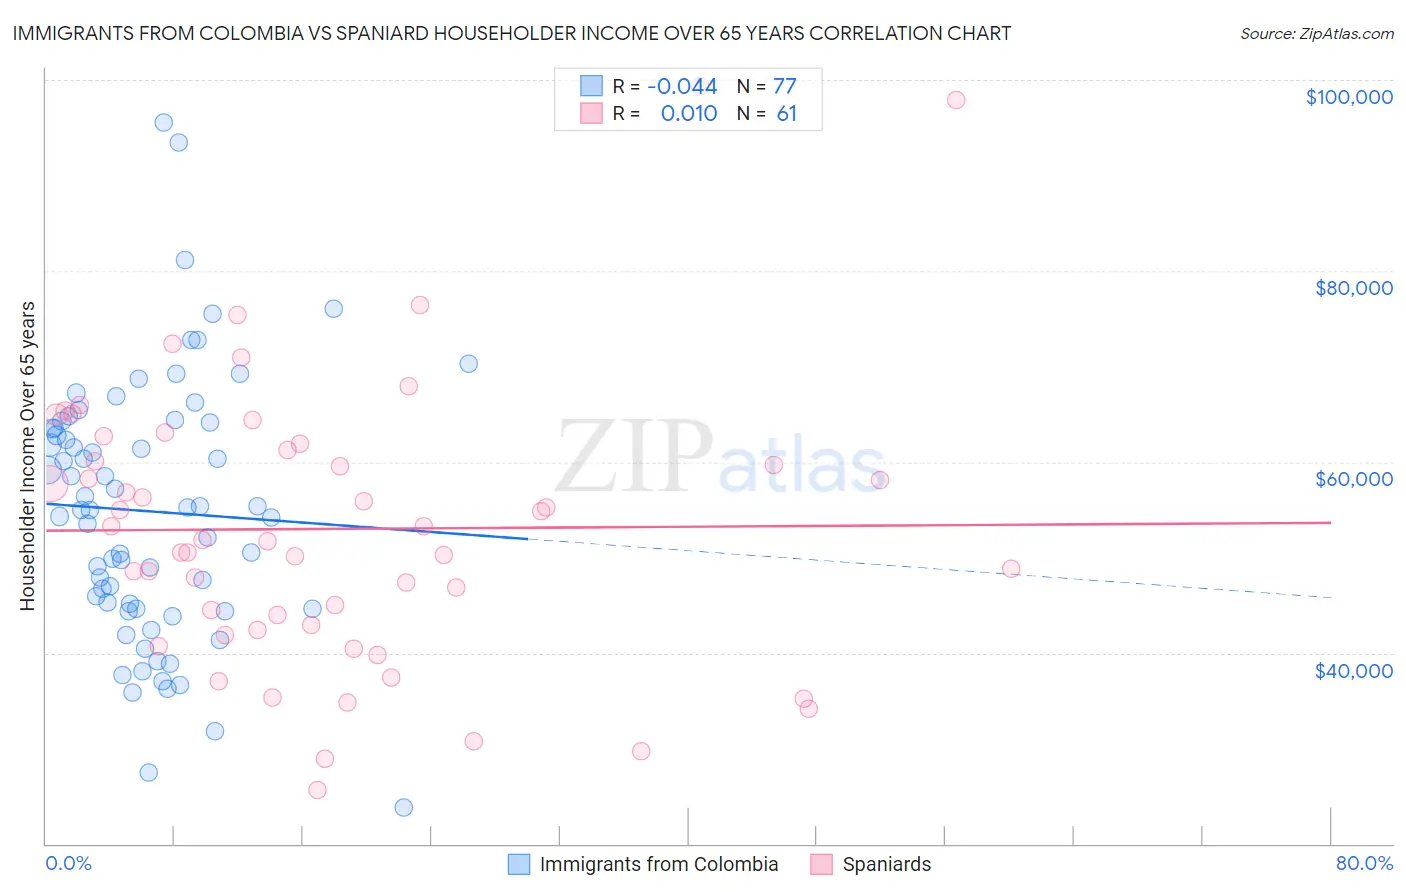
Immigrants from Colombia vs Spaniard Householder Income Over 65 years Correlation Chart
The statistical analysis conducted on geographies consisting of 377,569,928 people shows no correlation between the proportion of Immigrants from Colombia and household income with householder over the age of 65 in the United States with a correlation coefficient (R) of -0.044 and weighted average of $57,658. Similarly, the statistical analysis conducted on geographies consisting of 441,402,444 people shows no correlation between the proportion of Spaniards and household income with householder over the age of 65 in the United States with a correlation coefficient (R) of 0.010 and weighted average of $60,866, a difference of 5.6%.
Householder Income Over 65 years Correlation Summary
| Measurement | Immigrants from Colombia | Spaniard |
| Minimum | $23,750 | $25,625 |
| Maximum | $95,565 | $99,316 |
| Range | $71,815 | $73,691 |
| Mean | $54,810 | $52,982 |
| Median | $55,024 | $51,848 |
| Interquartile 25% (IQ1) | $44,579 | $42,711 |
| Interquartile 75% (IQ3) | $63,796 | $61,532 |
| Interquartile Range (IQR) | $19,217 | $18,821 |
| Standard Deviation (Sample) | $13,715 | $14,647 |
| Standard Deviation (Population) | $13,626 | $14,526 |
Similar Demographics by Householder Income Over 65 years
Demographics Similar to Immigrants from Colombia by Householder Income Over 65 years
In terms of householder income over 65 years, the demographic groups most similar to Immigrants from Colombia are Immigrants from Cambodia ($57,580, a difference of 0.14%), Immigrants from Albania ($57,828, a difference of 0.29%), Nonimmigrants ($57,426, a difference of 0.41%), Japanese ($57,919, a difference of 0.45%), and Immigrants from Venezuela ($57,371, a difference of 0.50%).
| Demographics | Rating | Rank | Householder Income Over 65 years |
| Delaware | 5.3 /100 | #222 | Tragic $58,214 |
| Tsimshian | 5.2 /100 | #223 | Tragic $58,202 |
| Bermudans | 5.1 /100 | #224 | Tragic $58,171 |
| Venezuelans | 4.4 /100 | #225 | Tragic $58,026 |
| French Canadians | 4.2 /100 | #226 | Tragic $57,975 |
| Japanese | 3.9 /100 | #227 | Tragic $57,919 |
| Immigrants | Albania | 3.6 /100 | #228 | Tragic $57,828 |
| Immigrants | Colombia | 3.0 /100 | #229 | Tragic $57,658 |
| Immigrants | Cambodia | 2.8 /100 | #230 | Tragic $57,580 |
| Immigrants | Nonimmigrants | 2.4 /100 | #231 | Tragic $57,426 |
| Immigrants | Venezuela | 2.3 /100 | #232 | Tragic $57,371 |
| Immigrants | Western Africa | 1.7 /100 | #233 | Tragic $57,119 |
| Immigrants | Burma/Myanmar | 1.7 /100 | #234 | Tragic $57,114 |
| Spanish Americans | 1.6 /100 | #235 | Tragic $57,021 |
| Immigrants | Uruguay | 1.5 /100 | #236 | Tragic $56,975 |
Demographics Similar to Spaniards by Householder Income Over 65 years
In terms of householder income over 65 years, the demographic groups most similar to Spaniards are Spanish ($60,795, a difference of 0.12%), Luxembourger ($60,967, a difference of 0.17%), Alaska Native ($60,748, a difference of 0.19%), Immigrants from Micronesia ($61,000, a difference of 0.22%), and Yup'ik ($60,727, a difference of 0.23%).
| Demographics | Rating | Rank | Householder Income Over 65 years |
| Irish | 53.4 /100 | #168 | Average $61,097 |
| Carpatho Rusyns | 53.3 /100 | #169 | Average $61,093 |
| Serbians | 53.1 /100 | #170 | Average $61,087 |
| Inupiat | 52.4 /100 | #171 | Average $61,061 |
| Immigrants | Poland | 51.9 /100 | #172 | Average $61,041 |
| Immigrants | Micronesia | 50.8 /100 | #173 | Average $61,000 |
| Luxembourgers | 50.0 /100 | #174 | Average $60,967 |
| Spaniards | 47.3 /100 | #175 | Average $60,866 |
| Spanish | 45.5 /100 | #176 | Average $60,795 |
| Alaska Natives | 44.3 /100 | #177 | Average $60,748 |
| Yup'ik | 43.7 /100 | #178 | Average $60,727 |
| Welsh | 42.2 /100 | #179 | Average $60,666 |
| Immigrants | Morocco | 41.7 /100 | #180 | Average $60,647 |
| Celtics | 40.7 /100 | #181 | Average $60,608 |
| Czechoslovakians | 40.0 /100 | #182 | Average $60,581 |