Immigrants from Colombia vs Yugoslavian Disability Age 18 to 34
COMPARE
Immigrants from Colombia
Yugoslavian
Disability Age 18 to 34
Disability Age 18 to 34 Comparison
Immigrants from Colombia
Yugoslavians
5.7%
DISABILITY AGE 18 TO 34
100.0/ 100
METRIC RATING
26th/ 347
METRIC RANK
7.2%
DISABILITY AGE 18 TO 34
0.8/ 100
METRIC RATING
247th/ 347
METRIC RANK
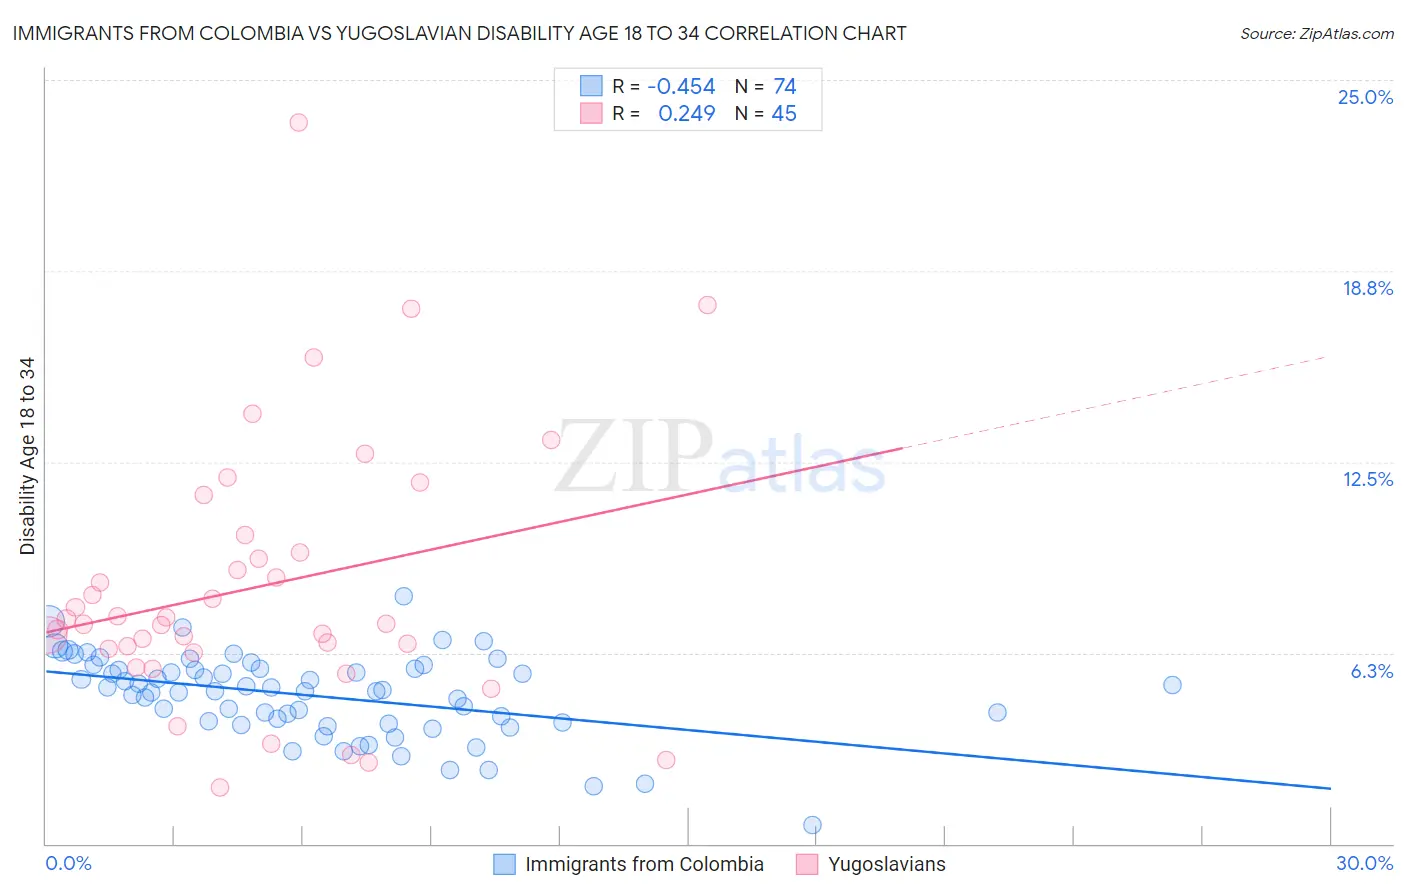
Immigrants from Colombia vs Yugoslavian Disability Age 18 to 34 Correlation Chart
The statistical analysis conducted on geographies consisting of 377,936,692 people shows a moderate negative correlation between the proportion of Immigrants from Colombia and percentage of population with a disability between the ages 18 and 35 in the United States with a correlation coefficient (R) of -0.454 and weighted average of 5.7%. Similarly, the statistical analysis conducted on geographies consisting of 285,257,895 people shows a weak positive correlation between the proportion of Yugoslavians and percentage of population with a disability between the ages 18 and 35 in the United States with a correlation coefficient (R) of 0.249 and weighted average of 7.2%, a difference of 25.0%.
Disability Age 18 to 34 Correlation Summary
| Measurement | Immigrants from Colombia | Yugoslavian |
| Minimum | 0.61% | 1.9% |
| Maximum | 8.1% | 23.6% |
| Range | 7.5% | 21.8% |
| Mean | 4.8% | 8.4% |
| Median | 5.0% | 7.2% |
| Interquartile 25% (IQ1) | 4.0% | 6.3% |
| Interquartile 75% (IQ3) | 5.7% | 9.8% |
| Interquartile Range (IQR) | 1.8% | 3.5% |
| Standard Deviation (Sample) | 1.4% | 4.3% |
| Standard Deviation (Population) | 1.4% | 4.3% |
Similar Demographics by Disability Age 18 to 34
Demographics Similar to Immigrants from Colombia by Disability Age 18 to 34
In terms of disability age 18 to 34, the demographic groups most similar to Immigrants from Colombia are Immigrants from Venezuela (5.7%, a difference of 0.11%), Immigrants from Singapore (5.7%, a difference of 0.15%), Immigrants from Argentina (5.7%, a difference of 0.19%), Soviet Union (5.7%, a difference of 0.20%), and Cuban (5.7%, a difference of 0.29%).
| Demographics | Rating | Rank | Disability Age 18 to 34 |
| Thais | 100.0 /100 | #19 | Exceptional 5.6% |
| Immigrants | Bangladesh | 100.0 /100 | #20 | Exceptional 5.6% |
| Immigrants | South Central Asia | 100.0 /100 | #21 | Exceptional 5.7% |
| Immigrants | Nicaragua | 100.0 /100 | #22 | Exceptional 5.7% |
| Cubans | 100.0 /100 | #23 | Exceptional 5.7% |
| Immigrants | Argentina | 100.0 /100 | #24 | Exceptional 5.7% |
| Immigrants | Singapore | 100.0 /100 | #25 | Exceptional 5.7% |
| Immigrants | Colombia | 100.0 /100 | #26 | Exceptional 5.7% |
| Immigrants | Venezuela | 99.9 /100 | #27 | Exceptional 5.7% |
| Soviet Union | 99.9 /100 | #28 | Exceptional 5.7% |
| Immigrants | Ecuador | 99.9 /100 | #29 | Exceptional 5.7% |
| Immigrants | Pakistan | 99.9 /100 | #30 | Exceptional 5.8% |
| Iranians | 99.9 /100 | #31 | Exceptional 5.8% |
| Immigrants | Barbados | 99.9 /100 | #32 | Exceptional 5.8% |
| Argentineans | 99.9 /100 | #33 | Exceptional 5.8% |
Demographics Similar to Yugoslavians by Disability Age 18 to 34
In terms of disability age 18 to 34, the demographic groups most similar to Yugoslavians are Guamanian/Chamorro (7.2%, a difference of 0.040%), Malaysian (7.2%, a difference of 0.13%), Immigrants from Liberia (7.1%, a difference of 0.15%), Hungarian (7.1%, a difference of 0.17%), and Immigrants from Zaire (7.1%, a difference of 0.27%).
| Demographics | Rating | Rank | Disability Age 18 to 34 |
| Arapaho | 1.1 /100 | #240 | Tragic 7.1% |
| Nepalese | 1.1 /100 | #241 | Tragic 7.1% |
| Immigrants | Congo | 1.1 /100 | #242 | Tragic 7.1% |
| Icelanders | 1.0 /100 | #243 | Tragic 7.1% |
| Immigrants | Zaire | 0.9 /100 | #244 | Tragic 7.1% |
| Hungarians | 0.9 /100 | #245 | Tragic 7.1% |
| Immigrants | Liberia | 0.8 /100 | #246 | Tragic 7.1% |
| Yugoslavians | 0.8 /100 | #247 | Tragic 7.2% |
| Guamanians/Chamorros | 0.8 /100 | #248 | Tragic 7.2% |
| Malaysians | 0.7 /100 | #249 | Tragic 7.2% |
| Fijians | 0.6 /100 | #250 | Tragic 7.2% |
| Spaniards | 0.6 /100 | #251 | Tragic 7.2% |
| Poles | 0.6 /100 | #252 | Tragic 7.2% |
| Croatians | 0.5 /100 | #253 | Tragic 7.2% |
| Indonesians | 0.4 /100 | #254 | Tragic 7.2% |