Immigrants from China vs Maltese Median Household Income
COMPARE
Immigrants from China
Maltese
Median Household Income
Median Household Income Comparison
Immigrants from China
Maltese
$105,335
MEDIAN HOUSEHOLD INCOME
100.0/ 100
METRIC RATING
11th/ 347
METRIC RANK
$97,015
MEDIAN HOUSEHOLD INCOME
100.0/ 100
METRIC RATING
40th/ 347
METRIC RANK
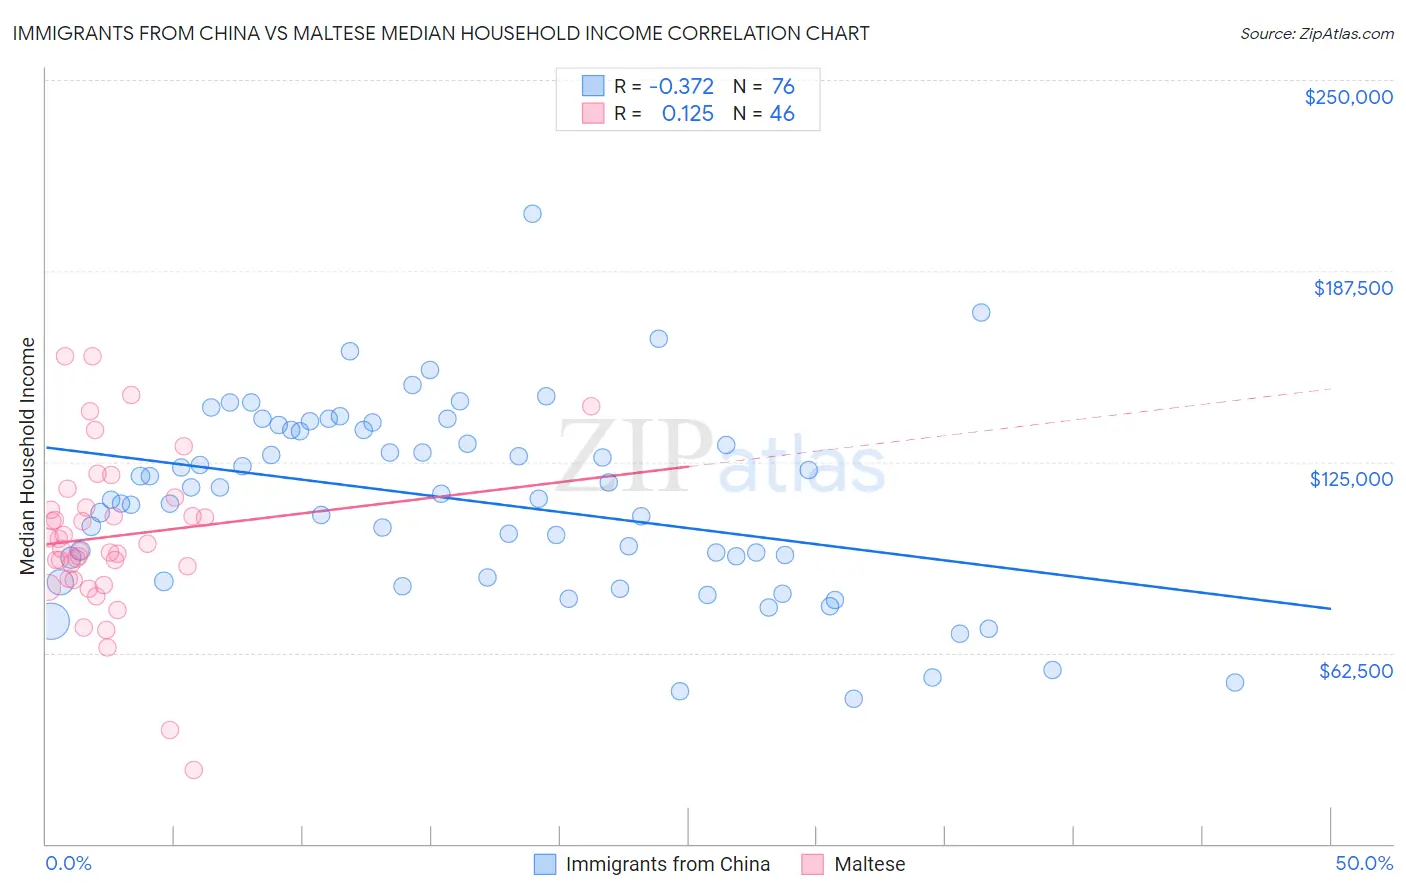
Immigrants from China vs Maltese Median Household Income Correlation Chart
The statistical analysis conducted on geographies consisting of 456,448,801 people shows a mild negative correlation between the proportion of Immigrants from China and median household income in the United States with a correlation coefficient (R) of -0.372 and weighted average of $105,335. Similarly, the statistical analysis conducted on geographies consisting of 126,420,319 people shows a poor positive correlation between the proportion of Maltese and median household income in the United States with a correlation coefficient (R) of 0.125 and weighted average of $97,015, a difference of 8.6%.
Median Household Income Correlation Summary
| Measurement | Immigrants from China | Maltese |
| Minimum | $47,386 | $24,250 |
| Maximum | $206,336 | $159,651 |
| Range | $158,950 | $135,401 |
| Mean | $112,457 | $100,571 |
| Median | $113,740 | $97,403 |
| Interquartile 25% (IQ1) | $90,379 | $86,626 |
| Interquartile 75% (IQ3) | $135,564 | $110,225 |
| Interquartile Range (IQR) | $45,185 | $23,599 |
| Standard Deviation (Sample) | $30,829 | $26,669 |
| Standard Deviation (Population) | $30,625 | $26,378 |
Similar Demographics by Median Household Income
Demographics Similar to Immigrants from China by Median Household Income
In terms of median household income, the demographic groups most similar to Immigrants from China are Indian (Asian) ($105,262, a difference of 0.070%), Immigrants from Eastern Asia ($104,796, a difference of 0.51%), Immigrants from Ireland ($104,692, a difference of 0.61%), Immigrants from South Central Asia ($106,057, a difference of 0.69%), and Immigrants from Israel ($104,090, a difference of 1.2%).
| Demographics | Rating | Rank | Median Household Income |
| Immigrants | Hong Kong | 100.0 /100 | #4 | Exceptional $111,519 |
| Thais | 100.0 /100 | #5 | Exceptional $110,648 |
| Immigrants | Singapore | 100.0 /100 | #6 | Exceptional $110,428 |
| Iranians | 100.0 /100 | #7 | Exceptional $109,835 |
| Immigrants | Iran | 100.0 /100 | #8 | Exceptional $108,055 |
| Okinawans | 100.0 /100 | #9 | Exceptional $106,624 |
| Immigrants | South Central Asia | 100.0 /100 | #10 | Exceptional $106,057 |
| Immigrants | China | 100.0 /100 | #11 | Exceptional $105,335 |
| Indians (Asian) | 100.0 /100 | #12 | Exceptional $105,262 |
| Immigrants | Eastern Asia | 100.0 /100 | #13 | Exceptional $104,796 |
| Immigrants | Ireland | 100.0 /100 | #14 | Exceptional $104,692 |
| Immigrants | Israel | 100.0 /100 | #15 | Exceptional $104,090 |
| Burmese | 100.0 /100 | #16 | Exceptional $103,145 |
| Immigrants | Korea | 100.0 /100 | #17 | Exceptional $102,962 |
| Cypriots | 100.0 /100 | #18 | Exceptional $102,843 |
Demographics Similar to Maltese by Median Household Income
In terms of median household income, the demographic groups most similar to Maltese are Afghan ($97,026, a difference of 0.010%), Immigrants from Turkey ($96,964, a difference of 0.050%), Immigrants from Lithuania ($96,836, a difference of 0.18%), Immigrants from France ($96,743, a difference of 0.28%), and Immigrants from Indonesia ($97,297, a difference of 0.29%).
| Demographics | Rating | Rank | Median Household Income |
| Chinese | 100.0 /100 | #33 | Exceptional $98,496 |
| Russians | 100.0 /100 | #34 | Exceptional $98,008 |
| Immigrants | Switzerland | 100.0 /100 | #35 | Exceptional $97,979 |
| Immigrants | Pakistan | 100.0 /100 | #36 | Exceptional $97,528 |
| Latvians | 100.0 /100 | #37 | Exceptional $97,311 |
| Immigrants | Indonesia | 100.0 /100 | #38 | Exceptional $97,297 |
| Afghans | 100.0 /100 | #39 | Exceptional $97,026 |
| Maltese | 100.0 /100 | #40 | Exceptional $97,015 |
| Immigrants | Turkey | 100.0 /100 | #41 | Exceptional $96,964 |
| Immigrants | Lithuania | 99.9 /100 | #42 | Exceptional $96,836 |
| Immigrants | France | 99.9 /100 | #43 | Exceptional $96,743 |
| Immigrants | Greece | 99.9 /100 | #44 | Exceptional $96,675 |
| Israelis | 99.9 /100 | #45 | Exceptional $96,552 |
| Australians | 99.9 /100 | #46 | Exceptional $96,490 |
| Immigrants | Russia | 99.9 /100 | #47 | Exceptional $96,378 |