Immigrants from China vs Guatemalan Median Earnings
COMPARE
Immigrants from China
Guatemalan
Median Earnings
Median Earnings Comparison
Immigrants from China
Guatemalans
$56,638
MEDIAN EARNINGS
100.0/ 100
METRIC RATING
13th/ 347
METRIC RANK
$41,205
MEDIAN EARNINGS
0.1/ 100
METRIC RATING
297th/ 347
METRIC RANK
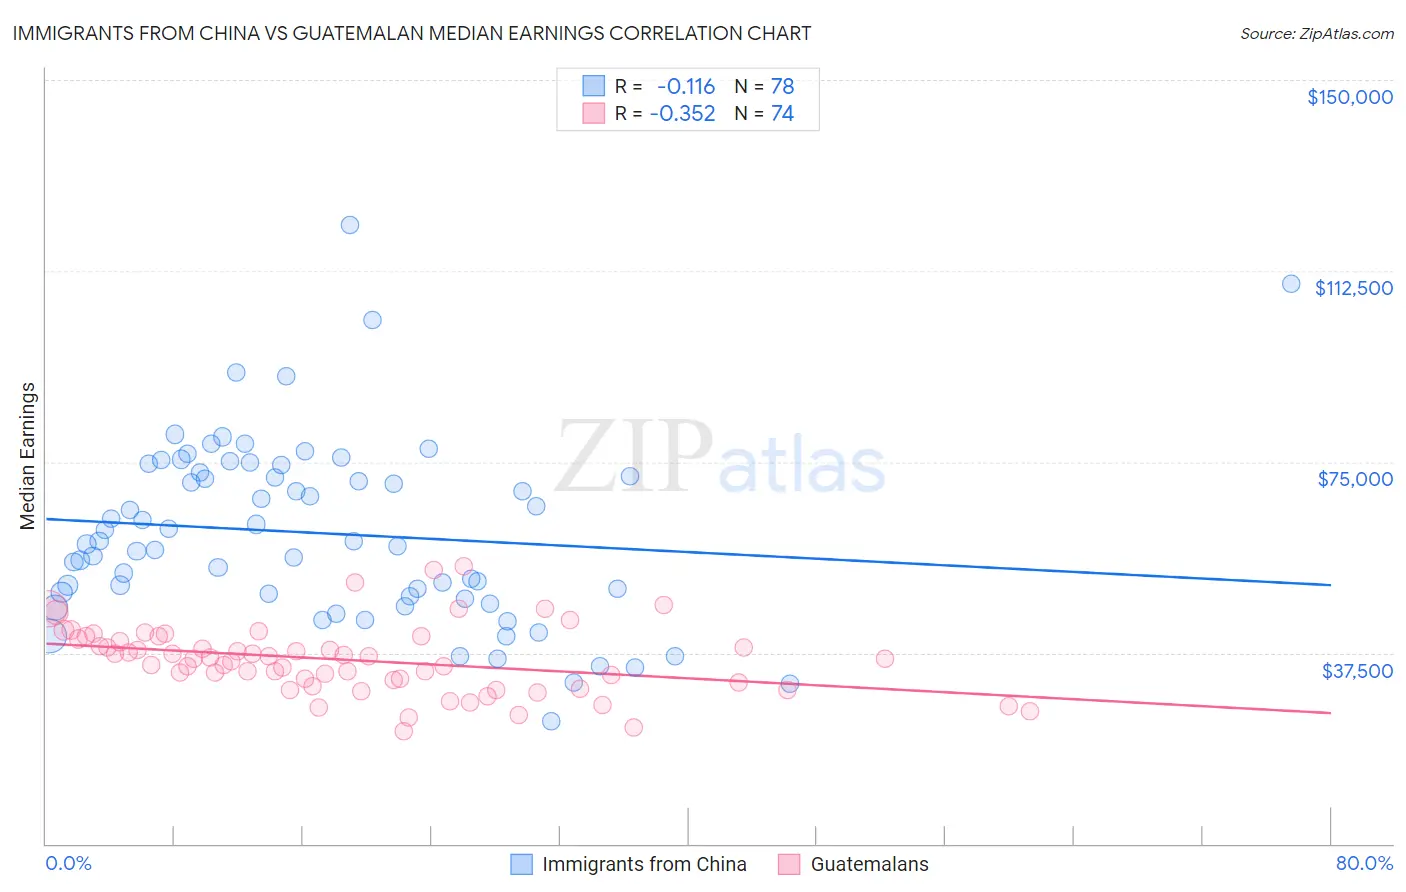
Immigrants from China vs Guatemalan Median Earnings Correlation Chart
The statistical analysis conducted on geographies consisting of 457,063,643 people shows a poor negative correlation between the proportion of Immigrants from China and median earnings in the United States with a correlation coefficient (R) of -0.116 and weighted average of $56,638. Similarly, the statistical analysis conducted on geographies consisting of 409,559,083 people shows a mild negative correlation between the proportion of Guatemalans and median earnings in the United States with a correlation coefficient (R) of -0.352 and weighted average of $41,205, a difference of 37.4%.
Median Earnings Correlation Summary
| Measurement | Immigrants from China | Guatemalan |
| Minimum | $23,942 | $22,174 |
| Maximum | $121,459 | $54,583 |
| Range | $97,517 | $32,409 |
| Mean | $60,963 | $36,063 |
| Median | $59,099 | $36,315 |
| Interquartile 25% (IQ1) | $48,648 | $31,673 |
| Interquartile 75% (IQ3) | $73,028 | $40,213 |
| Interquartile Range (IQR) | $24,380 | $8,540 |
| Standard Deviation (Sample) | $18,079 | $6,708 |
| Standard Deviation (Population) | $17,962 | $6,663 |
Similar Demographics by Median Earnings
Demographics Similar to Immigrants from China by Median Earnings
In terms of median earnings, the demographic groups most similar to Immigrants from China are Immigrants from Ireland ($56,854, a difference of 0.38%), Immigrants from Australia ($56,305, a difference of 0.59%), Indian (Asian) ($56,253, a difference of 0.68%), Immigrants from Israel ($57,034, a difference of 0.70%), and Immigrants from Eastern Asia ($56,183, a difference of 0.81%).
| Demographics | Rating | Rank | Median Earnings |
| Immigrants | Singapore | 100.0 /100 | #6 | Exceptional $59,038 |
| Iranians | 100.0 /100 | #7 | Exceptional $58,474 |
| Immigrants | Iran | 100.0 /100 | #8 | Exceptional $57,612 |
| Okinawans | 100.0 /100 | #9 | Exceptional $57,550 |
| Immigrants | South Central Asia | 100.0 /100 | #10 | Exceptional $57,114 |
| Immigrants | Israel | 100.0 /100 | #11 | Exceptional $57,034 |
| Immigrants | Ireland | 100.0 /100 | #12 | Exceptional $56,854 |
| Immigrants | China | 100.0 /100 | #13 | Exceptional $56,638 |
| Immigrants | Australia | 100.0 /100 | #14 | Exceptional $56,305 |
| Indians (Asian) | 100.0 /100 | #15 | Exceptional $56,253 |
| Immigrants | Eastern Asia | 100.0 /100 | #16 | Exceptional $56,183 |
| Eastern Europeans | 100.0 /100 | #17 | Exceptional $55,084 |
| Immigrants | Japan | 100.0 /100 | #18 | Exceptional $54,938 |
| Immigrants | Belgium | 100.0 /100 | #19 | Exceptional $54,679 |
| Cypriots | 100.0 /100 | #20 | Exceptional $54,589 |
Demographics Similar to Guatemalans by Median Earnings
In terms of median earnings, the demographic groups most similar to Guatemalans are Cherokee ($41,252, a difference of 0.11%), Bangladeshi ($41,263, a difference of 0.14%), Immigrants from Micronesia ($41,133, a difference of 0.17%), Potawatomi ($41,288, a difference of 0.20%), and Immigrants from Caribbean ($41,119, a difference of 0.21%).
| Demographics | Rating | Rank | Median Earnings |
| Paiute | 0.1 /100 | #290 | Tragic $41,508 |
| Central American Indians | 0.1 /100 | #291 | Tragic $41,474 |
| U.S. Virgin Islanders | 0.1 /100 | #292 | Tragic $41,448 |
| Immigrants | Zaire | 0.1 /100 | #293 | Tragic $41,325 |
| Potawatomi | 0.1 /100 | #294 | Tragic $41,288 |
| Bangladeshis | 0.1 /100 | #295 | Tragic $41,263 |
| Cherokee | 0.1 /100 | #296 | Tragic $41,252 |
| Guatemalans | 0.1 /100 | #297 | Tragic $41,205 |
| Immigrants | Micronesia | 0.1 /100 | #298 | Tragic $41,133 |
| Immigrants | Caribbean | 0.1 /100 | #299 | Tragic $41,119 |
| Ute | 0.1 /100 | #300 | Tragic $41,051 |
| Immigrants | Latin America | 0.1 /100 | #301 | Tragic $41,049 |
| Shoshone | 0.0 /100 | #302 | Tragic $40,932 |
| Haitians | 0.0 /100 | #303 | Tragic $40,918 |
| Immigrants | Guatemala | 0.0 /100 | #304 | Tragic $40,851 |