Immigrants from Chile vs Cambodian Bachelor's Degree
COMPARE
Immigrants from Chile
Cambodian
Bachelor's Degree
Bachelor's Degree Comparison
Immigrants from Chile
Cambodians
40.8%
BACHELOR'S DEGREE
96.4/ 100
METRIC RATING
111th/ 347
METRIC RANK
47.2%
BACHELOR'S DEGREE
100.0/ 100
METRIC RATING
19th/ 347
METRIC RANK
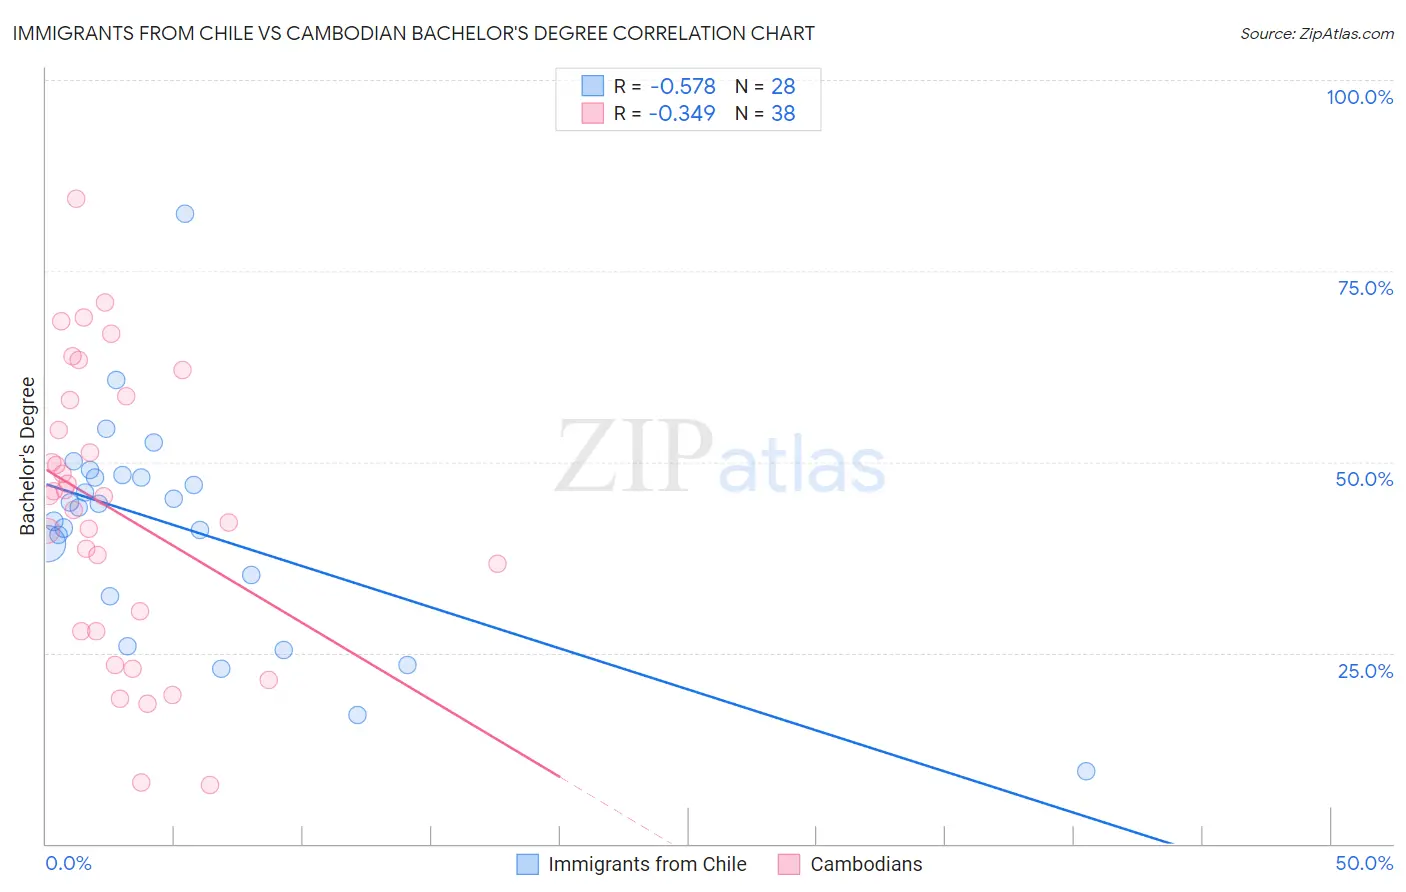
Immigrants from Chile vs Cambodian Bachelor's Degree Correlation Chart
The statistical analysis conducted on geographies consisting of 218,646,599 people shows a substantial negative correlation between the proportion of Immigrants from Chile and percentage of population with at least bachelor's degree education in the United States with a correlation coefficient (R) of -0.578 and weighted average of 40.8%. Similarly, the statistical analysis conducted on geographies consisting of 102,512,775 people shows a mild negative correlation between the proportion of Cambodians and percentage of population with at least bachelor's degree education in the United States with a correlation coefficient (R) of -0.349 and weighted average of 47.2%, a difference of 15.7%.
Bachelor's Degree Correlation Summary
| Measurement | Immigrants from Chile | Cambodian |
| Minimum | 9.5% | 7.6% |
| Maximum | 82.5% | 84.4% |
| Range | 72.9% | 76.8% |
| Mean | 41.4% | 43.6% |
| Median | 44.3% | 45.6% |
| Interquartile 25% (IQ1) | 33.8% | 27.8% |
| Interquartile 75% (IQ3) | 48.1% | 58.1% |
| Interquartile Range (IQR) | 14.3% | 30.3% |
| Standard Deviation (Sample) | 14.4% | 18.4% |
| Standard Deviation (Population) | 14.2% | 18.2% |
Similar Demographics by Bachelor's Degree
Demographics Similar to Immigrants from Chile by Bachelor's Degree
In terms of bachelor's degree, the demographic groups most similar to Immigrants from Chile are Albanian (40.9%, a difference of 0.050%), Ugandan (40.8%, a difference of 0.050%), Brazilian (40.8%, a difference of 0.090%), Arab (40.9%, a difference of 0.12%), and Afghan (40.8%, a difference of 0.12%).
| Demographics | Rating | Rank | Bachelor's Degree |
| Jordanians | 97.4 /100 | #104 | Exceptional 41.2% |
| Syrians | 97.4 /100 | #105 | Exceptional 41.1% |
| Alsatians | 97.0 /100 | #106 | Exceptional 41.0% |
| Northern Europeans | 96.8 /100 | #107 | Exceptional 41.0% |
| Ukrainians | 96.6 /100 | #108 | Exceptional 40.9% |
| Arabs | 96.6 /100 | #109 | Exceptional 40.9% |
| Albanians | 96.5 /100 | #110 | Exceptional 40.9% |
| Immigrants | Chile | 96.4 /100 | #111 | Exceptional 40.8% |
| Ugandans | 96.3 /100 | #112 | Exceptional 40.8% |
| Brazilians | 96.3 /100 | #113 | Exceptional 40.8% |
| Afghans | 96.2 /100 | #114 | Exceptional 40.8% |
| Palestinians | 95.8 /100 | #115 | Exceptional 40.7% |
| Immigrants | Uganda | 95.7 /100 | #116 | Exceptional 40.7% |
| Austrians | 95.5 /100 | #117 | Exceptional 40.6% |
| Croatians | 95.5 /100 | #118 | Exceptional 40.6% |
Demographics Similar to Cambodians by Bachelor's Degree
In terms of bachelor's degree, the demographic groups most similar to Cambodians are Immigrants from Switzerland (47.1%, a difference of 0.22%), Immigrants from Ireland (47.1%, a difference of 0.23%), Indian (Asian) (47.4%, a difference of 0.43%), Immigrants from Belgium (47.0%, a difference of 0.43%), and Immigrants from Sweden (47.0%, a difference of 0.52%).
| Demographics | Rating | Rank | Bachelor's Degree |
| Immigrants | China | 100.0 /100 | #12 | Exceptional 48.4% |
| Immigrants | South Central Asia | 100.0 /100 | #13 | Exceptional 48.3% |
| Immigrants | Hong Kong | 100.0 /100 | #14 | Exceptional 48.2% |
| Immigrants | Eastern Asia | 100.0 /100 | #15 | Exceptional 48.1% |
| Soviet Union | 100.0 /100 | #16 | Exceptional 47.9% |
| Eastern Europeans | 100.0 /100 | #17 | Exceptional 47.5% |
| Indians (Asian) | 100.0 /100 | #18 | Exceptional 47.4% |
| Cambodians | 100.0 /100 | #19 | Exceptional 47.2% |
| Immigrants | Switzerland | 100.0 /100 | #20 | Exceptional 47.1% |
| Immigrants | Ireland | 100.0 /100 | #21 | Exceptional 47.1% |
| Immigrants | Belgium | 100.0 /100 | #22 | Exceptional 47.0% |
| Immigrants | Sweden | 100.0 /100 | #23 | Exceptional 47.0% |
| Immigrants | Korea | 100.0 /100 | #24 | Exceptional 47.0% |
| Burmese | 100.0 /100 | #25 | Exceptional 46.9% |
| Immigrants | Japan | 100.0 /100 | #26 | Exceptional 46.8% |