Immigrants from Central America vs French Householder Income Ages 45 - 64 years
COMPARE
Immigrants from Central America
French
Householder Income Ages 45 - 64 years
Householder Income Ages 45 - 64 years Comparison
Immigrants from Central America
French
$85,965
HOUSEHOLDER INCOME AGES 45 - 64 YEARS
0.1/ 100
METRIC RATING
292nd/ 347
METRIC RANK
$99,824
HOUSEHOLDER INCOME AGES 45 - 64 YEARS
43.8/ 100
METRIC RATING
184th/ 347
METRIC RANK
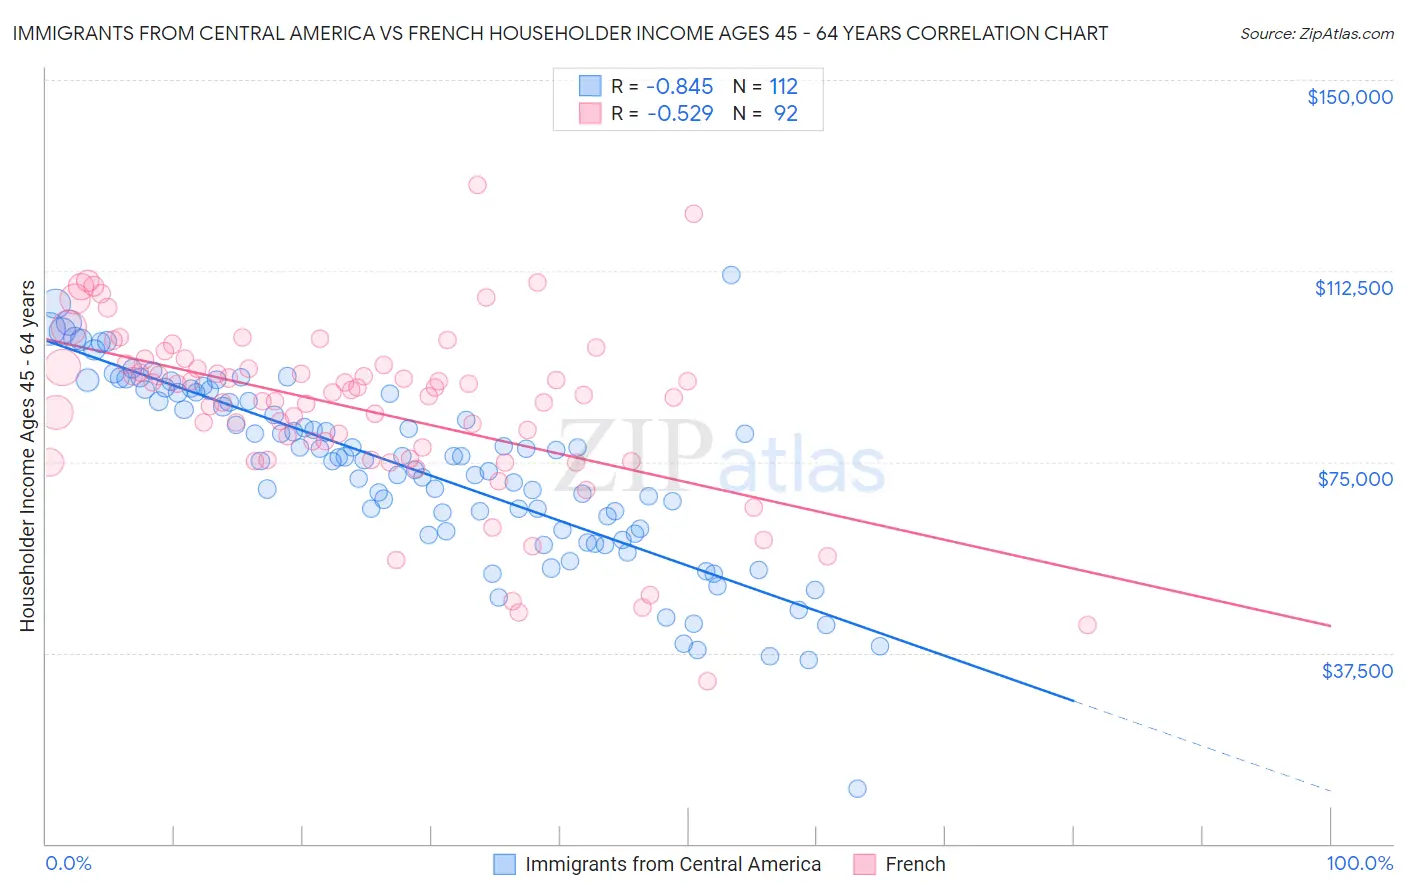
Immigrants from Central America vs French Householder Income Ages 45 - 64 years Correlation Chart
The statistical analysis conducted on geographies consisting of 533,887,943 people shows a very strong negative correlation between the proportion of Immigrants from Central America and household income with householder between the ages 45 and 64 in the United States with a correlation coefficient (R) of -0.845 and weighted average of $85,965. Similarly, the statistical analysis conducted on geographies consisting of 568,632,779 people shows a substantial negative correlation between the proportion of French and household income with householder between the ages 45 and 64 in the United States with a correlation coefficient (R) of -0.529 and weighted average of $99,824, a difference of 16.1%.
Householder Income Ages 45 - 64 years Correlation Summary
| Measurement | Immigrants from Central America | French |
| Minimum | $10,788 | $32,031 |
| Maximum | $111,667 | $129,396 |
| Range | $100,879 | $97,365 |
| Mean | $73,521 | $85,264 |
| Median | $75,933 | $88,490 |
| Interquartile 25% (IQ1) | $61,476 | $75,583 |
| Interquartile 75% (IQ3) | $88,461 | $93,777 |
| Interquartile Range (IQR) | $26,985 | $18,194 |
| Standard Deviation (Sample) | $17,981 | $17,163 |
| Standard Deviation (Population) | $17,900 | $17,070 |
Similar Demographics by Householder Income Ages 45 - 64 years
Demographics Similar to Immigrants from Central America by Householder Income Ages 45 - 64 years
In terms of householder income ages 45 - 64 years, the demographic groups most similar to Immigrants from Central America are Hispanic or Latino ($86,006, a difference of 0.050%), Cherokee ($86,125, a difference of 0.19%), Comanche ($85,787, a difference of 0.21%), Cuban ($86,301, a difference of 0.39%), and British West Indian ($85,571, a difference of 0.46%).
| Demographics | Rating | Rank | Householder Income Ages 45 - 64 years |
| Blackfeet | 0.1 /100 | #285 | Tragic $86,595 |
| Immigrants | Guatemala | 0.1 /100 | #286 | Tragic $86,573 |
| Bangladeshis | 0.1 /100 | #287 | Tragic $86,402 |
| Immigrants | St. Vincent and the Grenadines | 0.1 /100 | #288 | Tragic $86,394 |
| Cubans | 0.1 /100 | #289 | Tragic $86,301 |
| Cherokee | 0.1 /100 | #290 | Tragic $86,125 |
| Hispanics or Latinos | 0.1 /100 | #291 | Tragic $86,006 |
| Immigrants | Central America | 0.1 /100 | #292 | Tragic $85,965 |
| Comanche | 0.1 /100 | #293 | Tragic $85,787 |
| British West Indians | 0.1 /100 | #294 | Tragic $85,571 |
| Immigrants | Grenada | 0.1 /100 | #295 | Tragic $85,552 |
| Immigrants | Zaire | 0.1 /100 | #296 | Tragic $85,207 |
| Fijians | 0.1 /100 | #297 | Tragic $85,187 |
| Africans | 0.0 /100 | #298 | Tragic $84,925 |
| Immigrants | Mexico | 0.0 /100 | #299 | Tragic $84,910 |
Demographics Similar to French by Householder Income Ages 45 - 64 years
In terms of householder income ages 45 - 64 years, the demographic groups most similar to French are Colombian ($99,772, a difference of 0.050%), Spaniard ($99,889, a difference of 0.070%), Finnish ($99,904, a difference of 0.080%), Immigrants ($99,943, a difference of 0.12%), and Dutch ($99,650, a difference of 0.17%).
| Demographics | Rating | Rank | Householder Income Ages 45 - 64 years |
| Moroccans | 47.7 /100 | #177 | Average $100,138 |
| Immigrants | Cameroon | 47.0 /100 | #178 | Average $100,084 |
| Belgians | 46.7 /100 | #179 | Average $100,060 |
| Aleuts | 46.6 /100 | #180 | Average $100,052 |
| Immigrants | Immigrants | 45.3 /100 | #181 | Average $99,943 |
| Finns | 44.8 /100 | #182 | Average $99,904 |
| Spaniards | 44.6 /100 | #183 | Average $99,889 |
| French | 43.8 /100 | #184 | Average $99,824 |
| Colombians | 43.2 /100 | #185 | Average $99,772 |
| Dutch | 41.7 /100 | #186 | Average $99,650 |
| Iraqis | 38.5 /100 | #187 | Fair $99,387 |
| Immigrants | Portugal | 36.3 /100 | #188 | Fair $99,203 |
| Immigrants | South America | 35.4 /100 | #189 | Fair $99,126 |
| French Canadians | 35.1 /100 | #190 | Fair $99,093 |
| Kenyans | 33.7 /100 | #191 | Fair $98,970 |