Immigrants from Central America vs Honduran Householder Income Ages 45 - 64 years
COMPARE
Immigrants from Central America
Honduran
Householder Income Ages 45 - 64 years
Householder Income Ages 45 - 64 years Comparison
Immigrants from Central America
Hondurans
$85,965
HOUSEHOLDER INCOME AGES 45 - 64 YEARS
0.1/ 100
METRIC RATING
292nd/ 347
METRIC RANK
$84,079
HOUSEHOLDER INCOME AGES 45 - 64 YEARS
0.0/ 100
METRIC RATING
303rd/ 347
METRIC RANK
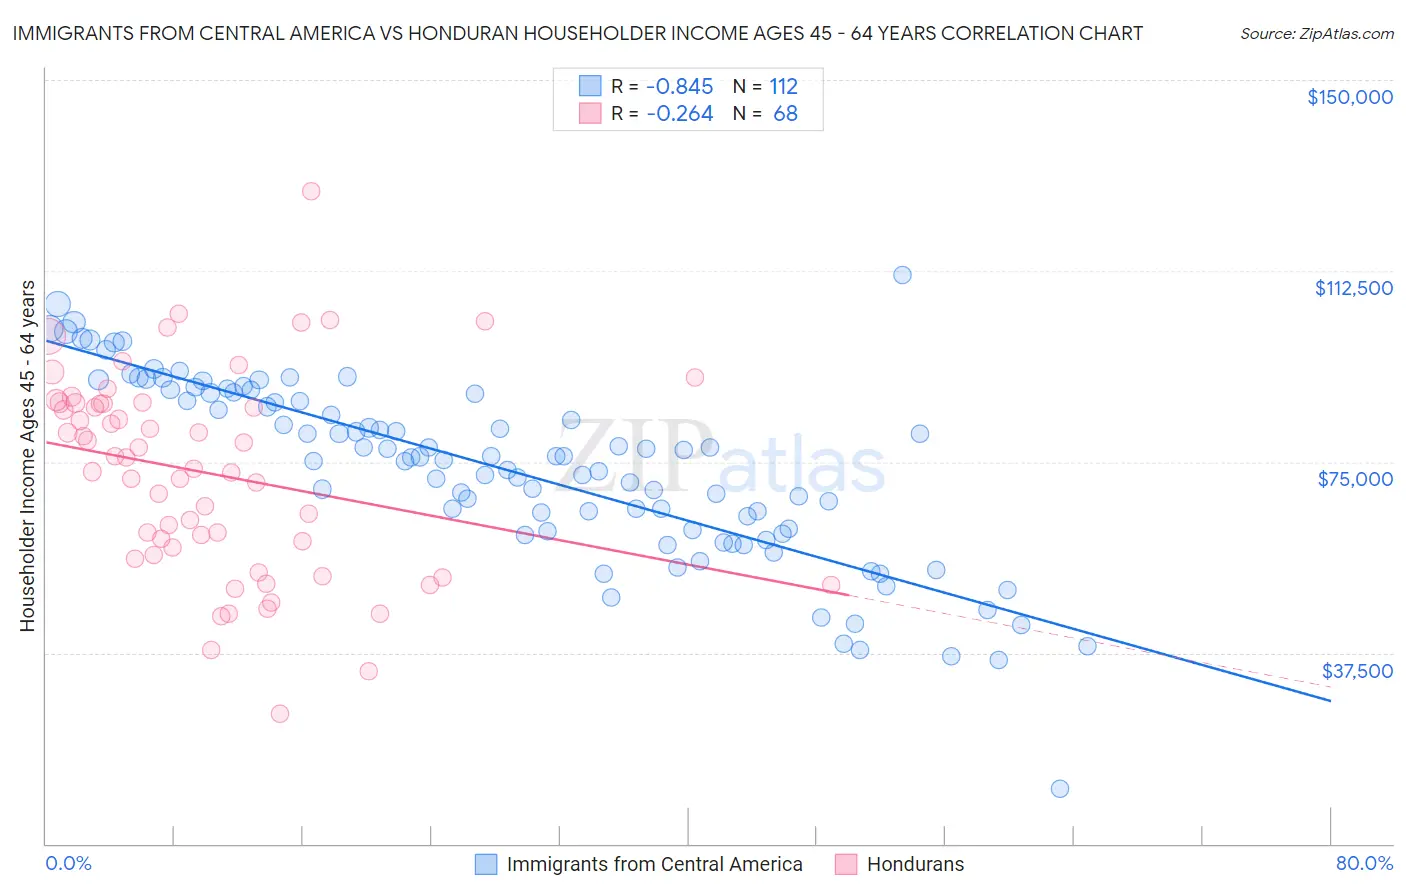
Immigrants from Central America vs Honduran Householder Income Ages 45 - 64 years Correlation Chart
The statistical analysis conducted on geographies consisting of 533,887,943 people shows a very strong negative correlation between the proportion of Immigrants from Central America and household income with householder between the ages 45 and 64 in the United States with a correlation coefficient (R) of -0.845 and weighted average of $85,965. Similarly, the statistical analysis conducted on geographies consisting of 357,242,150 people shows a weak negative correlation between the proportion of Hondurans and household income with householder between the ages 45 and 64 in the United States with a correlation coefficient (R) of -0.264 and weighted average of $84,079, a difference of 2.2%.
Householder Income Ages 45 - 64 years Correlation Summary
| Measurement | Immigrants from Central America | Honduran |
| Minimum | $10,788 | $25,625 |
| Maximum | $111,667 | $128,207 |
| Range | $100,879 | $102,582 |
| Mean | $73,521 | $72,746 |
| Median | $75,933 | $74,692 |
| Interquartile 25% (IQ1) | $61,476 | $57,383 |
| Interquartile 75% (IQ3) | $88,461 | $86,481 |
| Interquartile Range (IQR) | $26,985 | $29,098 |
| Standard Deviation (Sample) | $17,981 | $19,858 |
| Standard Deviation (Population) | $17,900 | $19,711 |
Demographics Similar to Immigrants from Central America and Hondurans by Householder Income Ages 45 - 64 years
In terms of householder income ages 45 - 64 years, the demographic groups most similar to Immigrants from Central America are Hispanic or Latino ($86,006, a difference of 0.050%), Cherokee ($86,125, a difference of 0.19%), Comanche ($85,787, a difference of 0.21%), Cuban ($86,301, a difference of 0.39%), and British West Indian ($85,571, a difference of 0.46%). Similarly, the demographic groups most similar to Hondurans are Ottawa ($83,953, a difference of 0.15%), Chippewa ($83,943, a difference of 0.16%), Ute ($83,937, a difference of 0.17%), Haitian ($84,384, a difference of 0.36%), and Shoshone ($83,588, a difference of 0.59%).
| Demographics | Rating | Rank | Householder Income Ages 45 - 64 years |
| Bangladeshis | 0.1 /100 | #287 | Tragic $86,402 |
| Immigrants | St. Vincent and the Grenadines | 0.1 /100 | #288 | Tragic $86,394 |
| Cubans | 0.1 /100 | #289 | Tragic $86,301 |
| Cherokee | 0.1 /100 | #290 | Tragic $86,125 |
| Hispanics or Latinos | 0.1 /100 | #291 | Tragic $86,006 |
| Immigrants | Central America | 0.1 /100 | #292 | Tragic $85,965 |
| Comanche | 0.1 /100 | #293 | Tragic $85,787 |
| British West Indians | 0.1 /100 | #294 | Tragic $85,571 |
| Immigrants | Grenada | 0.1 /100 | #295 | Tragic $85,552 |
| Immigrants | Zaire | 0.1 /100 | #296 | Tragic $85,207 |
| Fijians | 0.1 /100 | #297 | Tragic $85,187 |
| Africans | 0.0 /100 | #298 | Tragic $84,925 |
| Immigrants | Mexico | 0.0 /100 | #299 | Tragic $84,910 |
| Indonesians | 0.0 /100 | #300 | Tragic $84,890 |
| Potawatomi | 0.0 /100 | #301 | Tragic $84,613 |
| Haitians | 0.0 /100 | #302 | Tragic $84,384 |
| Hondurans | 0.0 /100 | #303 | Tragic $84,079 |
| Ottawa | 0.0 /100 | #304 | Tragic $83,953 |
| Chippewa | 0.0 /100 | #305 | Tragic $83,943 |
| Ute | 0.0 /100 | #306 | Tragic $83,937 |
| Shoshone | 0.0 /100 | #307 | Tragic $83,588 |