Immigrants from Central America vs Soviet Union Householder Income Ages 45 - 64 years
COMPARE
Immigrants from Central America
Soviet Union
Householder Income Ages 45 - 64 years
Householder Income Ages 45 - 64 years Comparison
Immigrants from Central America
Soviet Union
$85,965
HOUSEHOLDER INCOME AGES 45 - 64 YEARS
0.1/ 100
METRIC RATING
292nd/ 347
METRIC RANK
$112,008
HOUSEHOLDER INCOME AGES 45 - 64 YEARS
99.7/ 100
METRIC RATING
58th/ 347
METRIC RANK
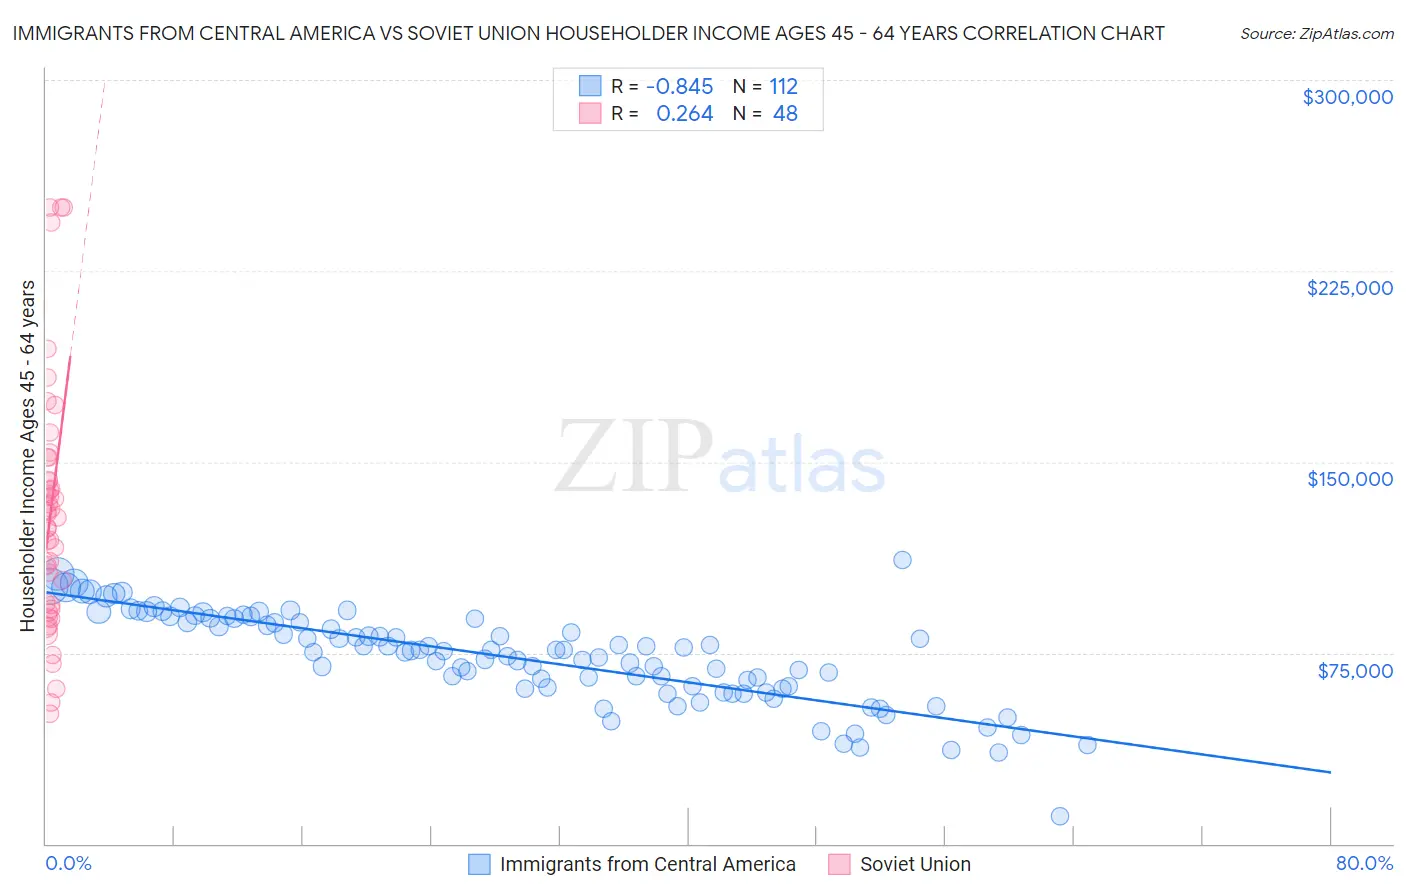
Immigrants from Central America vs Soviet Union Householder Income Ages 45 - 64 years Correlation Chart
The statistical analysis conducted on geographies consisting of 533,887,943 people shows a very strong negative correlation between the proportion of Immigrants from Central America and household income with householder between the ages 45 and 64 in the United States with a correlation coefficient (R) of -0.845 and weighted average of $85,965. Similarly, the statistical analysis conducted on geographies consisting of 43,509,359 people shows a weak positive correlation between the proportion of Soviet Union and household income with householder between the ages 45 and 64 in the United States with a correlation coefficient (R) of 0.264 and weighted average of $112,008, a difference of 30.3%.
Householder Income Ages 45 - 64 years Correlation Summary
| Measurement | Immigrants from Central America | Soviet Union |
| Minimum | $10,788 | $51,149 |
| Maximum | $111,667 | $250,001 |
| Range | $100,879 | $198,852 |
| Mean | $73,521 | $129,545 |
| Median | $75,933 | $126,259 |
| Interquartile 25% (IQ1) | $61,476 | $92,904 |
| Interquartile 75% (IQ3) | $88,461 | $147,283 |
| Interquartile Range (IQR) | $26,985 | $54,378 |
| Standard Deviation (Sample) | $17,981 | $48,678 |
| Standard Deviation (Population) | $17,900 | $48,168 |
Similar Demographics by Householder Income Ages 45 - 64 years
Demographics Similar to Immigrants from Central America by Householder Income Ages 45 - 64 years
In terms of householder income ages 45 - 64 years, the demographic groups most similar to Immigrants from Central America are Hispanic or Latino ($86,006, a difference of 0.050%), Cherokee ($86,125, a difference of 0.19%), Comanche ($85,787, a difference of 0.21%), Cuban ($86,301, a difference of 0.39%), and British West Indian ($85,571, a difference of 0.46%).
| Demographics | Rating | Rank | Householder Income Ages 45 - 64 years |
| Blackfeet | 0.1 /100 | #285 | Tragic $86,595 |
| Immigrants | Guatemala | 0.1 /100 | #286 | Tragic $86,573 |
| Bangladeshis | 0.1 /100 | #287 | Tragic $86,402 |
| Immigrants | St. Vincent and the Grenadines | 0.1 /100 | #288 | Tragic $86,394 |
| Cubans | 0.1 /100 | #289 | Tragic $86,301 |
| Cherokee | 0.1 /100 | #290 | Tragic $86,125 |
| Hispanics or Latinos | 0.1 /100 | #291 | Tragic $86,006 |
| Immigrants | Central America | 0.1 /100 | #292 | Tragic $85,965 |
| Comanche | 0.1 /100 | #293 | Tragic $85,787 |
| British West Indians | 0.1 /100 | #294 | Tragic $85,571 |
| Immigrants | Grenada | 0.1 /100 | #295 | Tragic $85,552 |
| Immigrants | Zaire | 0.1 /100 | #296 | Tragic $85,207 |
| Fijians | 0.1 /100 | #297 | Tragic $85,187 |
| Africans | 0.0 /100 | #298 | Tragic $84,925 |
| Immigrants | Mexico | 0.0 /100 | #299 | Tragic $84,910 |
Demographics Similar to Soviet Union by Householder Income Ages 45 - 64 years
In terms of householder income ages 45 - 64 years, the demographic groups most similar to Soviet Union are Immigrants from Europe ($111,984, a difference of 0.020%), Immigrants from Netherlands ($111,982, a difference of 0.020%), Immigrants from Czechoslovakia ($111,914, a difference of 0.080%), Immigrants from Scotland ($112,175, a difference of 0.15%), and Egyptian ($112,256, a difference of 0.22%).
| Demographics | Rating | Rank | Householder Income Ages 45 - 64 years |
| Immigrants | South Africa | 99.8 /100 | #51 | Exceptional $112,886 |
| Immigrants | Malaysia | 99.8 /100 | #52 | Exceptional $112,796 |
| Afghans | 99.8 /100 | #53 | Exceptional $112,676 |
| Greeks | 99.8 /100 | #54 | Exceptional $112,630 |
| Lithuanians | 99.8 /100 | #55 | Exceptional $112,484 |
| Egyptians | 99.7 /100 | #56 | Exceptional $112,256 |
| Immigrants | Scotland | 99.7 /100 | #57 | Exceptional $112,175 |
| Soviet Union | 99.7 /100 | #58 | Exceptional $112,008 |
| Immigrants | Europe | 99.7 /100 | #59 | Exceptional $111,984 |
| Immigrants | Netherlands | 99.7 /100 | #60 | Exceptional $111,982 |
| Immigrants | Czechoslovakia | 99.7 /100 | #61 | Exceptional $111,914 |
| Immigrants | Norway | 99.7 /100 | #62 | Exceptional $111,669 |
| Mongolians | 99.6 /100 | #63 | Exceptional $111,602 |
| Immigrants | Latvia | 99.6 /100 | #64 | Exceptional $111,454 |
| Immigrants | Belarus | 99.6 /100 | #65 | Exceptional $111,430 |