Immigrants from Central America vs Mexican American Indian Householder Income Ages 45 - 64 years
COMPARE
Immigrants from Central America
Mexican American Indian
Householder Income Ages 45 - 64 years
Householder Income Ages 45 - 64 years Comparison
Immigrants from Central America
Mexican American Indians
$85,965
HOUSEHOLDER INCOME AGES 45 - 64 YEARS
0.1/ 100
METRIC RATING
292nd/ 347
METRIC RANK
$90,811
HOUSEHOLDER INCOME AGES 45 - 64 YEARS
0.8/ 100
METRIC RATING
249th/ 347
METRIC RANK
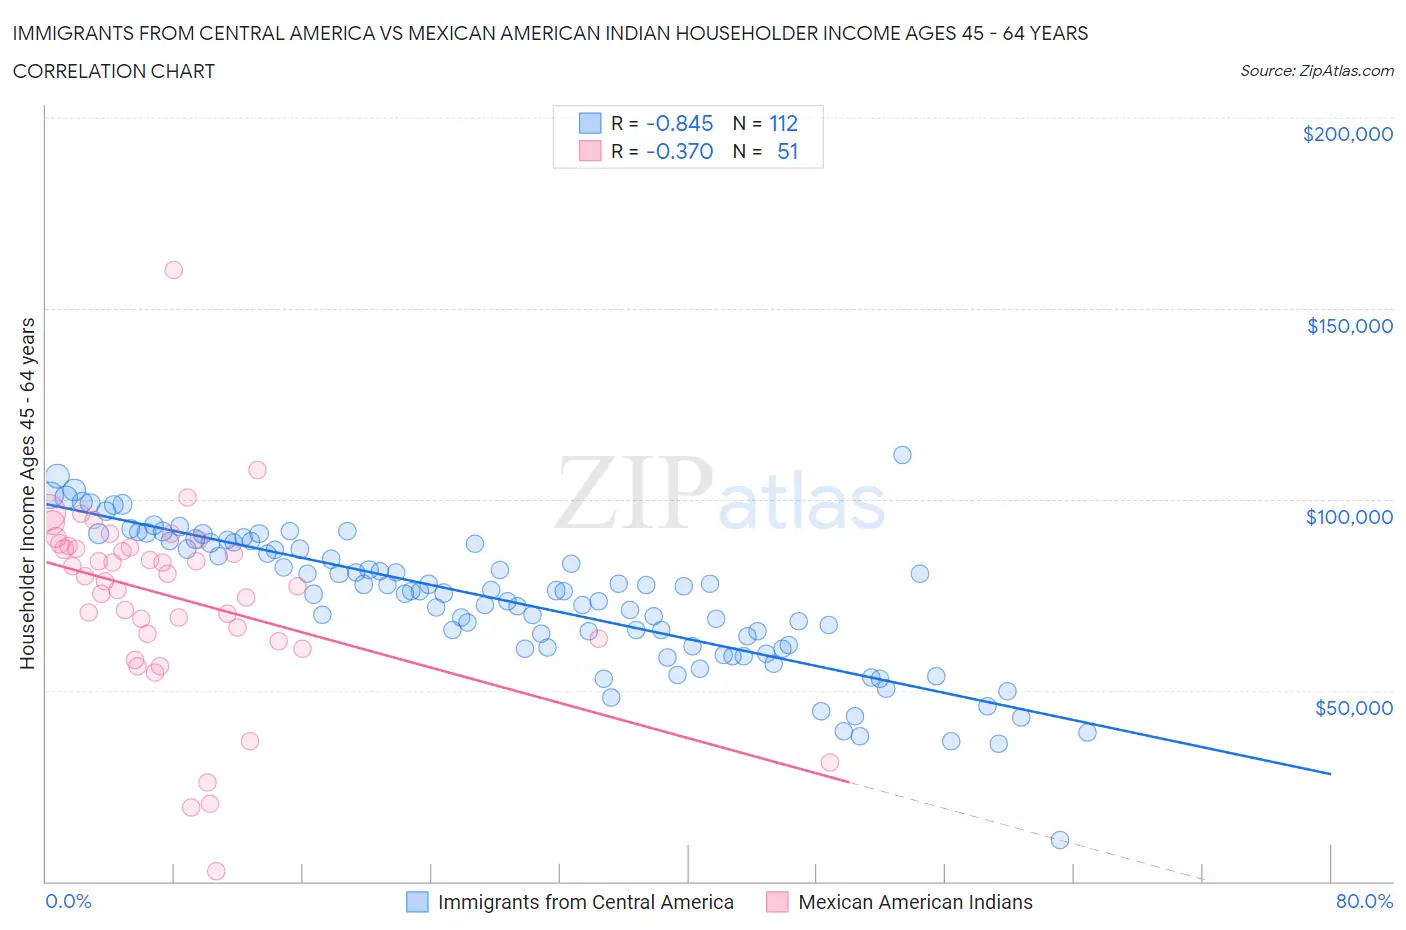
Immigrants from Central America vs Mexican American Indian Householder Income Ages 45 - 64 years Correlation Chart
The statistical analysis conducted on geographies consisting of 533,887,943 people shows a very strong negative correlation between the proportion of Immigrants from Central America and household income with householder between the ages 45 and 64 in the United States with a correlation coefficient (R) of -0.845 and weighted average of $85,965. Similarly, the statistical analysis conducted on geographies consisting of 317,180,991 people shows a mild negative correlation between the proportion of Mexican American Indians and household income with householder between the ages 45 and 64 in the United States with a correlation coefficient (R) of -0.370 and weighted average of $90,811, a difference of 5.6%.
Householder Income Ages 45 - 64 years Correlation Summary
| Measurement | Immigrants from Central America | Mexican American Indian |
| Minimum | $10,788 | $2,499 |
| Maximum | $111,667 | $160,170 |
| Range | $100,879 | $157,671 |
| Mean | $73,521 | $74,348 |
| Median | $75,933 | $79,926 |
| Interquartile 25% (IQ1) | $61,476 | $63,438 |
| Interquartile 75% (IQ3) | $88,461 | $87,647 |
| Interquartile Range (IQR) | $26,985 | $24,209 |
| Standard Deviation (Sample) | $17,981 | $25,470 |
| Standard Deviation (Population) | $17,900 | $25,219 |
Similar Demographics by Householder Income Ages 45 - 64 years
Demographics Similar to Immigrants from Central America by Householder Income Ages 45 - 64 years
In terms of householder income ages 45 - 64 years, the demographic groups most similar to Immigrants from Central America are Hispanic or Latino ($86,006, a difference of 0.050%), Cherokee ($86,125, a difference of 0.19%), Comanche ($85,787, a difference of 0.21%), Cuban ($86,301, a difference of 0.39%), and British West Indian ($85,571, a difference of 0.46%).
| Demographics | Rating | Rank | Householder Income Ages 45 - 64 years |
| Blackfeet | 0.1 /100 | #285 | Tragic $86,595 |
| Immigrants | Guatemala | 0.1 /100 | #286 | Tragic $86,573 |
| Bangladeshis | 0.1 /100 | #287 | Tragic $86,402 |
| Immigrants | St. Vincent and the Grenadines | 0.1 /100 | #288 | Tragic $86,394 |
| Cubans | 0.1 /100 | #289 | Tragic $86,301 |
| Cherokee | 0.1 /100 | #290 | Tragic $86,125 |
| Hispanics or Latinos | 0.1 /100 | #291 | Tragic $86,006 |
| Immigrants | Central America | 0.1 /100 | #292 | Tragic $85,965 |
| Comanche | 0.1 /100 | #293 | Tragic $85,787 |
| British West Indians | 0.1 /100 | #294 | Tragic $85,571 |
| Immigrants | Grenada | 0.1 /100 | #295 | Tragic $85,552 |
| Immigrants | Zaire | 0.1 /100 | #296 | Tragic $85,207 |
| Fijians | 0.1 /100 | #297 | Tragic $85,187 |
| Africans | 0.0 /100 | #298 | Tragic $84,925 |
| Immigrants | Mexico | 0.0 /100 | #299 | Tragic $84,910 |
Demographics Similar to Mexican American Indians by Householder Income Ages 45 - 64 years
In terms of householder income ages 45 - 64 years, the demographic groups most similar to Mexican American Indians are Immigrants from Laos ($90,909, a difference of 0.11%), Subsaharan African ($90,691, a difference of 0.13%), Central American ($90,951, a difference of 0.15%), Alaskan Athabascan ($90,951, a difference of 0.15%), and Guyanese ($90,966, a difference of 0.17%).
| Demographics | Rating | Rank | Householder Income Ages 45 - 64 years |
| Inupiat | 1.1 /100 | #242 | Tragic $91,355 |
| Immigrants | Trinidad and Tobago | 1.1 /100 | #243 | Tragic $91,347 |
| Immigrants | Middle Africa | 1.1 /100 | #244 | Tragic $91,293 |
| Guyanese | 0.9 /100 | #245 | Tragic $90,966 |
| Central Americans | 0.9 /100 | #246 | Tragic $90,951 |
| Alaskan Athabascans | 0.9 /100 | #247 | Tragic $90,951 |
| Immigrants | Laos | 0.9 /100 | #248 | Tragic $90,909 |
| Mexican American Indians | 0.8 /100 | #249 | Tragic $90,811 |
| Sub-Saharan Africans | 0.8 /100 | #250 | Tragic $90,691 |
| Americans | 0.7 /100 | #251 | Tragic $90,536 |
| Marshallese | 0.7 /100 | #252 | Tragic $90,455 |
| Barbadians | 0.6 /100 | #253 | Tragic $90,266 |
| Immigrants | Guyana | 0.6 /100 | #254 | Tragic $90,186 |
| West Indians | 0.5 /100 | #255 | Tragic $89,906 |
| French American Indians | 0.5 /100 | #256 | Tragic $89,811 |