Puget Sound Salish vs Mexican American Indian Householder Income Ages 45 - 64 years
COMPARE
Puget Sound Salish
Mexican American Indian
Householder Income Ages 45 - 64 years
Householder Income Ages 45 - 64 years Comparison
Puget Sound Salish
Mexican American Indians
$98,340
HOUSEHOLDER INCOME AGES 45 - 64 YEARS
27.0/ 100
METRIC RATING
197th/ 347
METRIC RANK
$90,811
HOUSEHOLDER INCOME AGES 45 - 64 YEARS
0.8/ 100
METRIC RATING
249th/ 347
METRIC RANK
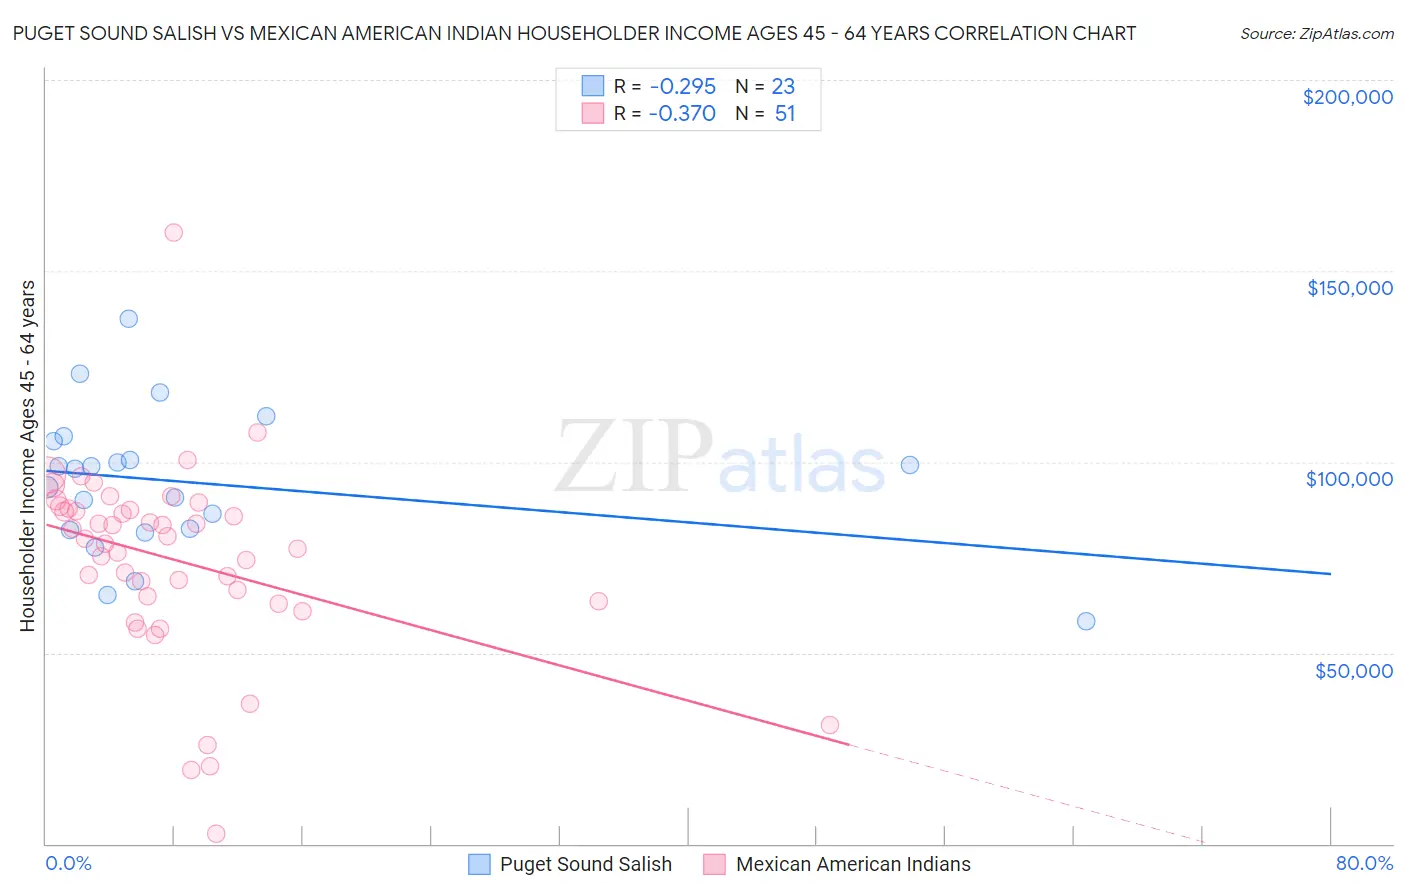
Puget Sound Salish vs Mexican American Indian Householder Income Ages 45 - 64 years Correlation Chart
The statistical analysis conducted on geographies consisting of 46,126,240 people shows a weak negative correlation between the proportion of Puget Sound Salish and household income with householder between the ages 45 and 64 in the United States with a correlation coefficient (R) of -0.295 and weighted average of $98,340. Similarly, the statistical analysis conducted on geographies consisting of 317,180,991 people shows a mild negative correlation between the proportion of Mexican American Indians and household income with householder between the ages 45 and 64 in the United States with a correlation coefficient (R) of -0.370 and weighted average of $90,811, a difference of 8.3%.
Householder Income Ages 45 - 64 years Correlation Summary
| Measurement | Puget Sound Salish | Mexican American Indian |
| Minimum | $58,333 | $2,499 |
| Maximum | $137,604 | $160,170 |
| Range | $79,271 | $157,671 |
| Mean | $94,554 | $74,348 |
| Median | $98,357 | $79,926 |
| Interquartile 25% (IQ1) | $82,172 | $63,438 |
| Interquartile 75% (IQ3) | $105,339 | $87,647 |
| Interquartile Range (IQR) | $23,167 | $24,209 |
| Standard Deviation (Sample) | $18,602 | $25,470 |
| Standard Deviation (Population) | $18,193 | $25,219 |
Similar Demographics by Householder Income Ages 45 - 64 years
Demographics Similar to Puget Sound Salish by Householder Income Ages 45 - 64 years
In terms of householder income ages 45 - 64 years, the demographic groups most similar to Puget Sound Salish are Immigrants from Eastern Africa ($98,467, a difference of 0.13%), Immigrants from Iraq ($98,201, a difference of 0.14%), Spanish ($98,554, a difference of 0.22%), White/Caucasian ($98,091, a difference of 0.25%), and Uruguayan ($98,660, a difference of 0.32%).
| Demographics | Rating | Rank | Householder Income Ages 45 - 64 years |
| French Canadians | 35.1 /100 | #190 | Fair $99,093 |
| Kenyans | 33.7 /100 | #191 | Fair $98,970 |
| Celtics | 32.9 /100 | #192 | Fair $98,896 |
| Hawaiians | 31.6 /100 | #193 | Fair $98,778 |
| Uruguayans | 30.3 /100 | #194 | Fair $98,660 |
| Spanish | 29.2 /100 | #195 | Fair $98,554 |
| Immigrants | Eastern Africa | 28.3 /100 | #196 | Fair $98,467 |
| Puget Sound Salish | 27.0 /100 | #197 | Fair $98,340 |
| Immigrants | Iraq | 25.7 /100 | #198 | Fair $98,201 |
| Whites/Caucasians | 24.6 /100 | #199 | Fair $98,091 |
| Immigrants | Kenya | 23.5 /100 | #200 | Fair $97,964 |
| Yugoslavians | 20.0 /100 | #201 | Fair $97,558 |
| Tlingit-Haida | 18.9 /100 | #202 | Poor $97,417 |
| Immigrants | Thailand | 18.8 /100 | #203 | Poor $97,400 |
| Immigrants | Eritrea | 18.6 /100 | #204 | Poor $97,373 |
Demographics Similar to Mexican American Indians by Householder Income Ages 45 - 64 years
In terms of householder income ages 45 - 64 years, the demographic groups most similar to Mexican American Indians are Immigrants from Laos ($90,909, a difference of 0.11%), Subsaharan African ($90,691, a difference of 0.13%), Central American ($90,951, a difference of 0.15%), Alaskan Athabascan ($90,951, a difference of 0.15%), and Guyanese ($90,966, a difference of 0.17%).
| Demographics | Rating | Rank | Householder Income Ages 45 - 64 years |
| Inupiat | 1.1 /100 | #242 | Tragic $91,355 |
| Immigrants | Trinidad and Tobago | 1.1 /100 | #243 | Tragic $91,347 |
| Immigrants | Middle Africa | 1.1 /100 | #244 | Tragic $91,293 |
| Guyanese | 0.9 /100 | #245 | Tragic $90,966 |
| Central Americans | 0.9 /100 | #246 | Tragic $90,951 |
| Alaskan Athabascans | 0.9 /100 | #247 | Tragic $90,951 |
| Immigrants | Laos | 0.9 /100 | #248 | Tragic $90,909 |
| Mexican American Indians | 0.8 /100 | #249 | Tragic $90,811 |
| Sub-Saharan Africans | 0.8 /100 | #250 | Tragic $90,691 |
| Americans | 0.7 /100 | #251 | Tragic $90,536 |
| Marshallese | 0.7 /100 | #252 | Tragic $90,455 |
| Barbadians | 0.6 /100 | #253 | Tragic $90,266 |
| Immigrants | Guyana | 0.6 /100 | #254 | Tragic $90,186 |
| West Indians | 0.5 /100 | #255 | Tragic $89,906 |
| French American Indians | 0.5 /100 | #256 | Tragic $89,811 |