Immigrants from Central America vs Honduran 10th Grade
COMPARE
Immigrants from Central America
Honduran
10th Grade
10th Grade Comparison
Immigrants from Central America
Hondurans
86.6%
10TH GRADE
0.0/ 100
METRIC RATING
345th/ 347
METRIC RANK
89.0%
10TH GRADE
0.0/ 100
METRIC RATING
333rd/ 347
METRIC RANK
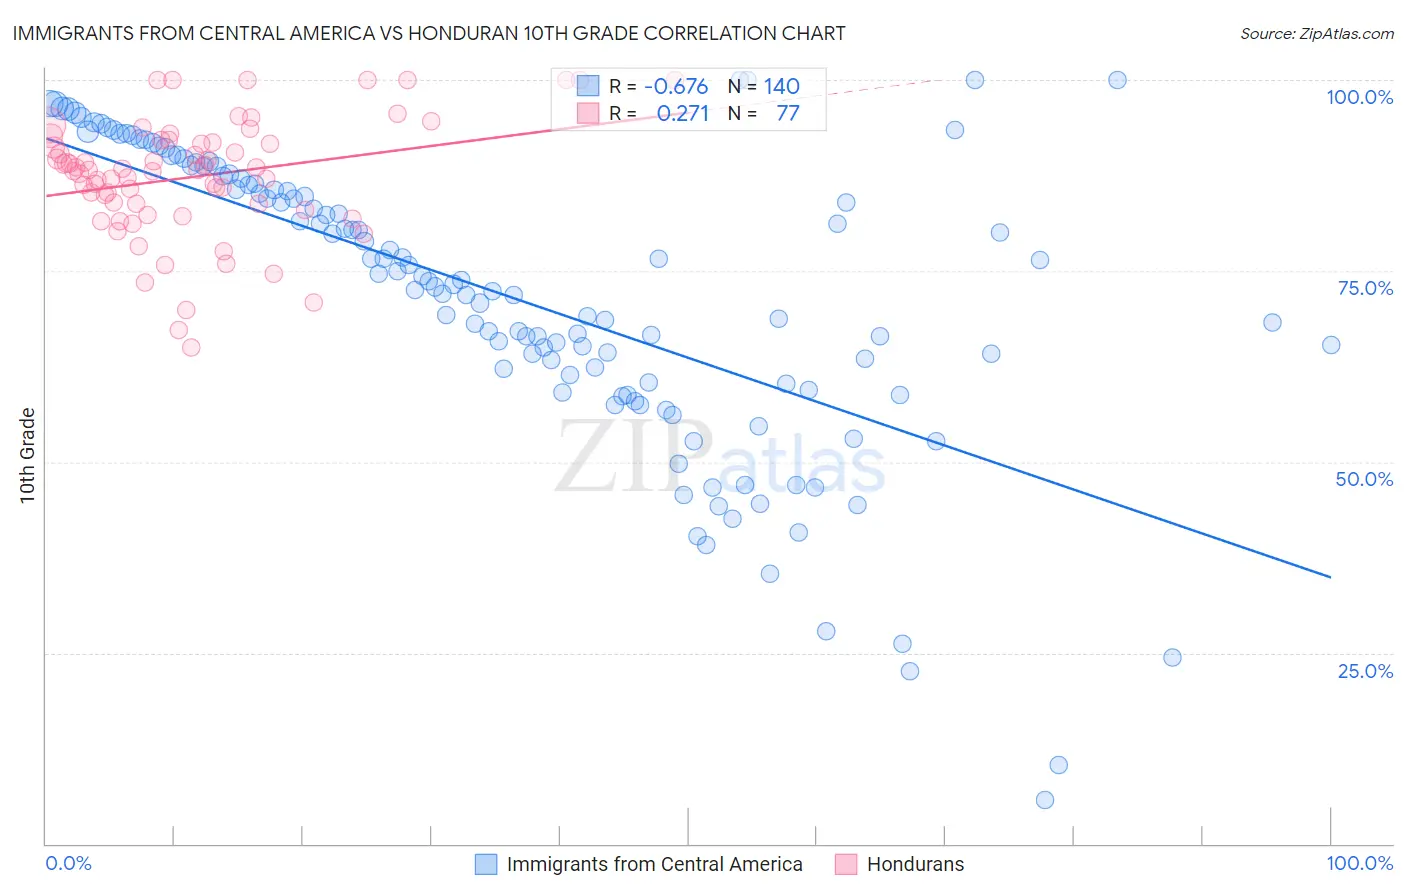
Immigrants from Central America vs Honduran 10th Grade Correlation Chart
The statistical analysis conducted on geographies consisting of 536,553,521 people shows a significant negative correlation between the proportion of Immigrants from Central America and percentage of population with at least 10th grade education in the United States with a correlation coefficient (R) of -0.676 and weighted average of 86.6%. Similarly, the statistical analysis conducted on geographies consisting of 357,858,827 people shows a weak positive correlation between the proportion of Hondurans and percentage of population with at least 10th grade education in the United States with a correlation coefficient (R) of 0.271 and weighted average of 89.0%, a difference of 2.7%.
10th Grade Correlation Summary
| Measurement | Immigrants from Central America | Honduran |
| Minimum | 5.7% | 65.0% |
| Maximum | 100.0% | 100.0% |
| Range | 94.3% | 35.0% |
| Mean | 71.5% | 87.3% |
| Median | 73.5% | 88.2% |
| Interquartile 25% (IQ1) | 60.3% | 83.4% |
| Interquartile 75% (IQ3) | 86.7% | 92.0% |
| Interquartile Range (IQR) | 26.4% | 8.6% |
| Standard Deviation (Sample) | 19.3% | 7.7% |
| Standard Deviation (Population) | 19.3% | 7.7% |
Demographics Similar to Immigrants from Central America and Hondurans by 10th Grade
In terms of 10th grade, the demographic groups most similar to Immigrants from Central America are Immigrants from El Salvador (86.8%, a difference of 0.18%), Yakama (86.9%, a difference of 0.32%), Spanish American Indian (86.2%, a difference of 0.45%), Immigrants from Mexico (86.2%, a difference of 0.47%), and Immigrants from Guatemala (87.4%, a difference of 0.90%). Similarly, the demographic groups most similar to Hondurans are Immigrants from the Azores (89.0%, a difference of 0.030%), Mexican American Indian (89.0%, a difference of 0.070%), Immigrants from Yemen (89.1%, a difference of 0.10%), Hispanic or Latino (88.9%, a difference of 0.12%), and Immigrants from Dominican Republic (88.7%, a difference of 0.30%).
| Demographics | Rating | Rank | 10th Grade |
| Immigrants | Cabo Verde | 0.0 /100 | #328 | Tragic 89.5% |
| Dominicans | 0.0 /100 | #329 | Tragic 89.4% |
| Immigrants | Yemen | 0.0 /100 | #330 | Tragic 89.1% |
| Mexican American Indians | 0.0 /100 | #331 | Tragic 89.0% |
| Immigrants | Azores | 0.0 /100 | #332 | Tragic 89.0% |
| Hondurans | 0.0 /100 | #333 | Tragic 89.0% |
| Hispanics or Latinos | 0.0 /100 | #334 | Tragic 88.9% |
| Immigrants | Dominican Republic | 0.0 /100 | #335 | Tragic 88.7% |
| Immigrants | Honduras | 0.0 /100 | #336 | Tragic 88.5% |
| Central Americans | 0.0 /100 | #337 | Tragic 88.4% |
| Immigrants | Latin America | 0.0 /100 | #338 | Tragic 88.3% |
| Guatemalans | 0.0 /100 | #339 | Tragic 87.9% |
| Mexicans | 0.0 /100 | #340 | Tragic 87.8% |
| Salvadorans | 0.0 /100 | #341 | Tragic 87.5% |
| Immigrants | Guatemala | 0.0 /100 | #342 | Tragic 87.4% |
| Yakama | 0.0 /100 | #343 | Tragic 86.9% |
| Immigrants | El Salvador | 0.0 /100 | #344 | Tragic 86.8% |
| Immigrants | Central America | 0.0 /100 | #345 | Tragic 86.6% |
| Spanish American Indians | 0.0 /100 | #346 | Tragic 86.2% |
| Immigrants | Mexico | 0.0 /100 | #347 | Tragic 86.2% |