Immigrants from Central America vs Hawaiian Median Male Earnings
COMPARE
Immigrants from Central America
Hawaiian
Median Male Earnings
Median Male Earnings Comparison
Immigrants from Central America
Hawaiians
$45,538
MEDIAN MALE EARNINGS
0.0/ 100
METRIC RATING
323rd/ 347
METRIC RANK
$50,488
MEDIAN MALE EARNINGS
1.9/ 100
METRIC RATING
245th/ 347
METRIC RANK
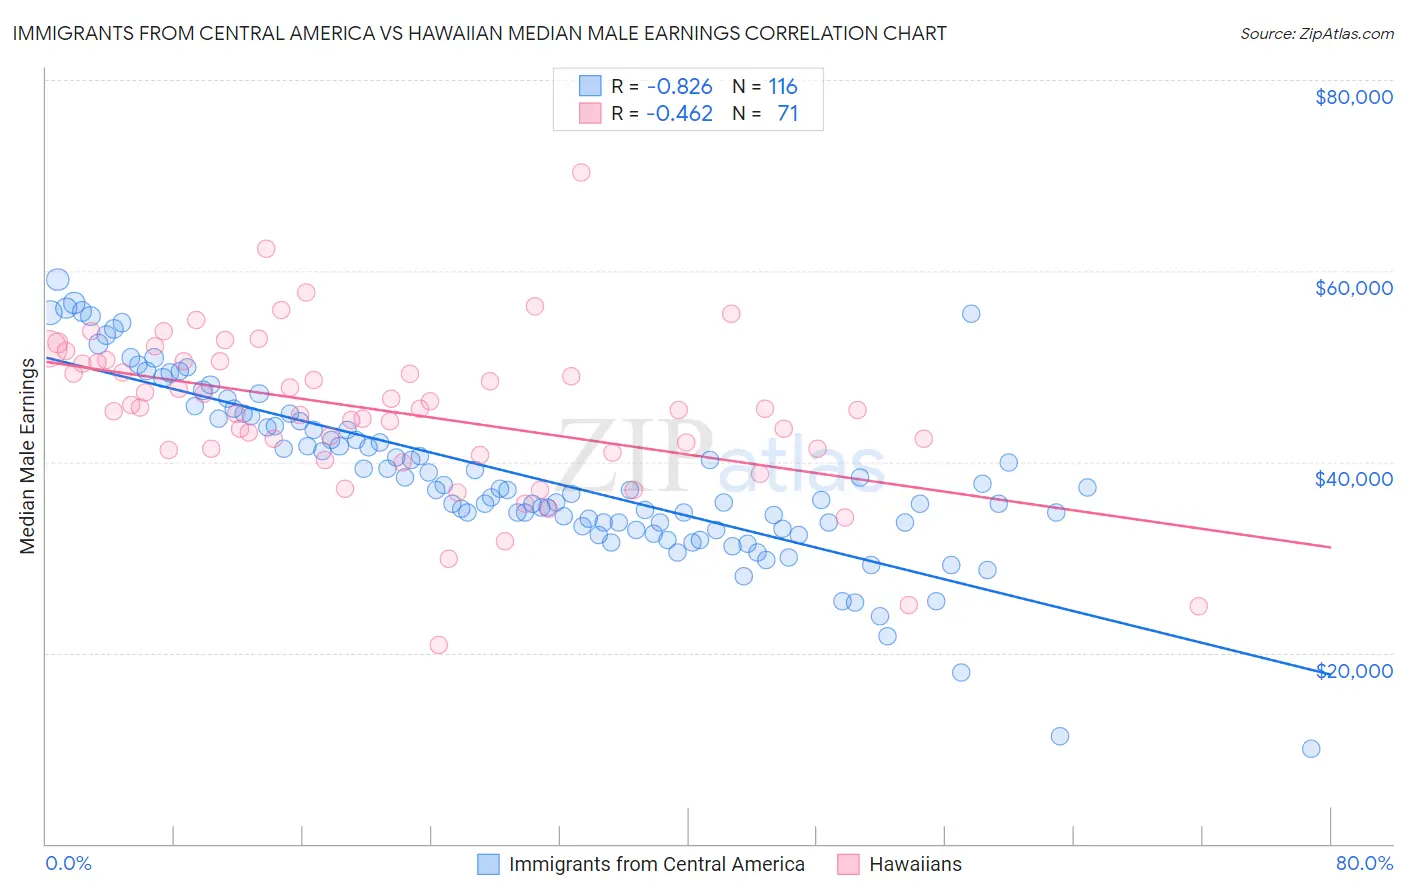
Immigrants from Central America vs Hawaiian Median Male Earnings Correlation Chart
The statistical analysis conducted on geographies consisting of 535,785,073 people shows a very strong negative correlation between the proportion of Immigrants from Central America and median male earnings in the United States with a correlation coefficient (R) of -0.826 and weighted average of $45,538. Similarly, the statistical analysis conducted on geographies consisting of 327,518,939 people shows a moderate negative correlation between the proportion of Hawaiians and median male earnings in the United States with a correlation coefficient (R) of -0.462 and weighted average of $50,488, a difference of 10.9%.
Median Male Earnings Correlation Summary
| Measurement | Immigrants from Central America | Hawaiian |
| Minimum | $9,917 | $20,774 |
| Maximum | $59,113 | $70,362 |
| Range | $49,196 | $49,588 |
| Mean | $38,565 | $45,275 |
| Median | $37,031 | $45,568 |
| Interquartile 25% (IQ1) | $33,411 | $41,232 |
| Interquartile 75% (IQ3) | $44,421 | $50,512 |
| Interquartile Range (IQR) | $11,009 | $9,280 |
| Standard Deviation (Sample) | $9,104 | $8,332 |
| Standard Deviation (Population) | $9,065 | $8,273 |
Similar Demographics by Median Male Earnings
Demographics Similar to Immigrants from Central America by Median Male Earnings
In terms of median male earnings, the demographic groups most similar to Immigrants from Central America are Black/African American ($45,523, a difference of 0.030%), Sioux ($45,566, a difference of 0.060%), Fijian ($45,607, a difference of 0.15%), Yuman ($45,446, a difference of 0.20%), and Immigrants from Honduras ($45,787, a difference of 0.55%).
| Demographics | Rating | Rank | Median Male Earnings |
| Immigrants | Caribbean | 0.0 /100 | #316 | Tragic $46,193 |
| Mexicans | 0.0 /100 | #317 | Tragic $46,147 |
| Cheyenne | 0.0 /100 | #318 | Tragic $46,062 |
| Haitians | 0.0 /100 | #319 | Tragic $45,903 |
| Immigrants | Honduras | 0.0 /100 | #320 | Tragic $45,787 |
| Fijians | 0.0 /100 | #321 | Tragic $45,607 |
| Sioux | 0.0 /100 | #322 | Tragic $45,566 |
| Immigrants | Central America | 0.0 /100 | #323 | Tragic $45,538 |
| Blacks/African Americans | 0.0 /100 | #324 | Tragic $45,523 |
| Yuman | 0.0 /100 | #325 | Tragic $45,446 |
| Immigrants | Haiti | 0.0 /100 | #326 | Tragic $45,266 |
| Immigrants | Bahamas | 0.0 /100 | #327 | Tragic $45,176 |
| Kiowa | 0.0 /100 | #328 | Tragic $45,094 |
| Yakama | 0.0 /100 | #329 | Tragic $45,002 |
| Immigrants | Mexico | 0.0 /100 | #330 | Tragic $44,960 |
Demographics Similar to Hawaiians by Median Male Earnings
In terms of median male earnings, the demographic groups most similar to Hawaiians are Immigrants from Ecuador ($50,474, a difference of 0.030%), Houma ($50,547, a difference of 0.12%), Subsaharan African ($50,408, a difference of 0.16%), French American Indian ($50,611, a difference of 0.24%), and Guyanese ($50,613, a difference of 0.25%).
| Demographics | Rating | Rank | Median Male Earnings |
| Malaysians | 2.5 /100 | #238 | Tragic $50,772 |
| Americans | 2.5 /100 | #239 | Tragic $50,761 |
| West Indians | 2.3 /100 | #240 | Tragic $50,682 |
| Immigrants | St. Vincent and the Grenadines | 2.3 /100 | #241 | Tragic $50,665 |
| Guyanese | 2.2 /100 | #242 | Tragic $50,613 |
| French American Indians | 2.2 /100 | #243 | Tragic $50,611 |
| Houma | 2.0 /100 | #244 | Tragic $50,547 |
| Hawaiians | 1.9 /100 | #245 | Tragic $50,488 |
| Immigrants | Ecuador | 1.9 /100 | #246 | Tragic $50,474 |
| Sub-Saharan Africans | 1.8 /100 | #247 | Tragic $50,408 |
| Immigrants | Guyana | 1.6 /100 | #248 | Tragic $50,321 |
| Immigrants | Burma/Myanmar | 1.6 /100 | #249 | Tragic $50,298 |
| Osage | 1.6 /100 | #250 | Tragic $50,292 |
| Immigrants | Grenada | 1.6 /100 | #251 | Tragic $50,279 |
| Immigrants | Cabo Verde | 1.2 /100 | #252 | Tragic $50,009 |