Immigrants from Central America vs Hawaiian 5th Grade
COMPARE
Immigrants from Central America
Hawaiian
5th Grade
5th Grade Comparison
Immigrants from Central America
Hawaiians
94.7%
5TH GRADE
0.0/ 100
METRIC RATING
342nd/ 347
METRIC RANK
97.2%
5TH GRADE
25.6/ 100
METRIC RATING
196th/ 347
METRIC RANK
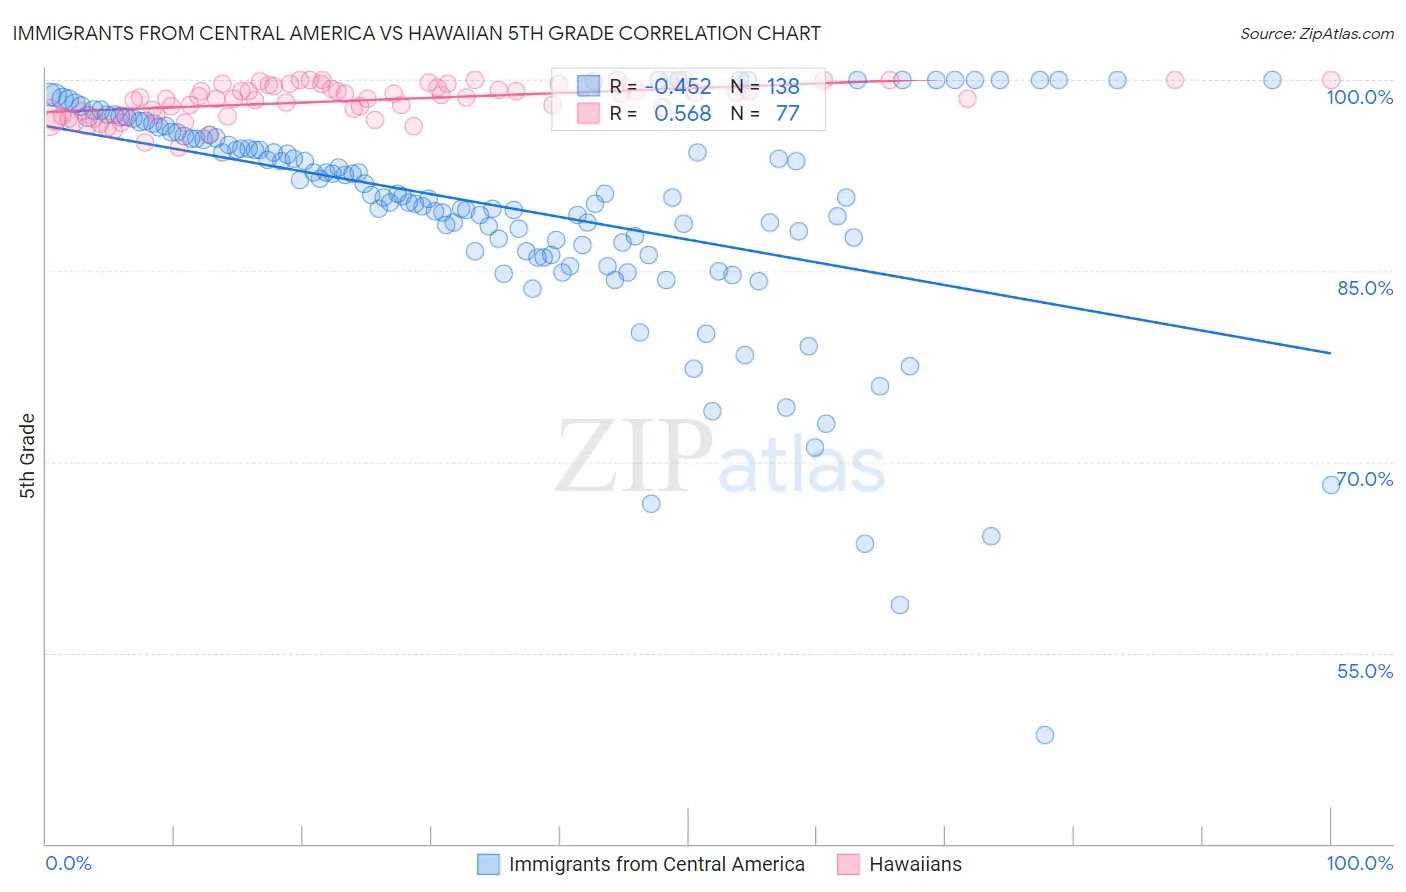
Immigrants from Central America vs Hawaiian 5th Grade Correlation Chart
The statistical analysis conducted on geographies consisting of 536,554,577 people shows a moderate negative correlation between the proportion of Immigrants from Central America and percentage of population with at least 5th grade education in the United States with a correlation coefficient (R) of -0.452 and weighted average of 94.7%. Similarly, the statistical analysis conducted on geographies consisting of 327,621,279 people shows a substantial positive correlation between the proportion of Hawaiians and percentage of population with at least 5th grade education in the United States with a correlation coefficient (R) of 0.568 and weighted average of 97.2%, a difference of 2.7%.
5th Grade Correlation Summary
| Measurement | Immigrants from Central America | Hawaiian |
| Minimum | 48.6% | 94.7% |
| Maximum | 100.0% | 100.0% |
| Range | 51.4% | 5.3% |
| Mean | 90.0% | 98.4% |
| Median | 91.0% | 98.7% |
| Interquartile 25% (IQ1) | 87.0% | 97.2% |
| Interquartile 75% (IQ3) | 95.9% | 99.7% |
| Interquartile Range (IQR) | 8.9% | 2.5% |
| Standard Deviation (Sample) | 8.8% | 1.3% |
| Standard Deviation (Population) | 8.8% | 1.3% |
Similar Demographics by 5th Grade
Demographics Similar to Immigrants from Central America by 5th Grade
In terms of 5th grade, the demographic groups most similar to Immigrants from Central America are Salvadoran (94.6%, a difference of 0.060%), Immigrants from Mexico (94.6%, a difference of 0.060%), Immigrants from Guatemala (94.6%, a difference of 0.060%), Yakama (94.8%, a difference of 0.10%), and Guatemalan (94.8%, a difference of 0.18%).
| Demographics | Rating | Rank | 5th Grade |
| Immigrants | Latin America | 0.0 /100 | #333 | Tragic 95.3% |
| Nepalese | 0.0 /100 | #334 | Tragic 95.2% |
| Mexicans | 0.0 /100 | #335 | Tragic 95.2% |
| Immigrants | Azores | 0.0 /100 | #336 | Tragic 95.1% |
| Central Americans | 0.0 /100 | #337 | Tragic 95.1% |
| Immigrants | Cabo Verde | 0.0 /100 | #338 | Tragic 94.9% |
| Immigrants | Yemen | 0.0 /100 | #339 | Tragic 94.9% |
| Guatemalans | 0.0 /100 | #340 | Tragic 94.8% |
| Yakama | 0.0 /100 | #341 | Tragic 94.8% |
| Immigrants | Central America | 0.0 /100 | #342 | Tragic 94.7% |
| Salvadorans | 0.0 /100 | #343 | Tragic 94.6% |
| Immigrants | Mexico | 0.0 /100 | #344 | Tragic 94.6% |
| Immigrants | Guatemala | 0.0 /100 | #345 | Tragic 94.6% |
| Immigrants | El Salvador | 0.0 /100 | #346 | Tragic 94.3% |
| Spanish American Indians | 0.0 /100 | #347 | Tragic 94.2% |
Demographics Similar to Hawaiians by 5th Grade
In terms of 5th grade, the demographic groups most similar to Hawaiians are Brazilian (97.2%, a difference of 0.0%), Guamanian/Chamorro (97.2%, a difference of 0.010%), Navajo (97.2%, a difference of 0.020%), Immigrants from Albania (97.2%, a difference of 0.020%), and Black/African American (97.3%, a difference of 0.030%).
| Demographics | Rating | Rank | 5th Grade |
| Immigrants | Egypt | 32.9 /100 | #189 | Fair 97.3% |
| Blacks/African Americans | 31.8 /100 | #190 | Fair 97.3% |
| Immigrants | Brazil | 31.5 /100 | #191 | Fair 97.3% |
| Panamanians | 31.3 /100 | #192 | Fair 97.3% |
| Navajo | 29.0 /100 | #193 | Fair 97.2% |
| Immigrants | Albania | 28.5 /100 | #194 | Fair 97.2% |
| Guamanians/Chamorros | 26.8 /100 | #195 | Fair 97.2% |
| Hawaiians | 25.6 /100 | #196 | Fair 97.2% |
| Brazilians | 25.4 /100 | #197 | Fair 97.2% |
| Immigrants | Uganda | 21.1 /100 | #198 | Fair 97.2% |
| Natives/Alaskans | 18.0 /100 | #199 | Poor 97.2% |
| Immigrants | Northern Africa | 16.8 /100 | #200 | Poor 97.2% |
| Immigrants | Chile | 16.6 /100 | #201 | Poor 97.2% |
| Africans | 15.3 /100 | #202 | Poor 97.2% |
| Immigrants | Bahamas | 14.9 /100 | #203 | Poor 97.2% |