German Russian vs French Householder Income Ages 45 - 64 years
COMPARE
German Russian
French
Householder Income Ages 45 - 64 years
Householder Income Ages 45 - 64 years Comparison
German Russians
French
$89,398
HOUSEHOLDER INCOME AGES 45 - 64 YEARS
0.4/ 100
METRIC RATING
257th/ 347
METRIC RANK
$99,824
HOUSEHOLDER INCOME AGES 45 - 64 YEARS
43.8/ 100
METRIC RATING
184th/ 347
METRIC RANK
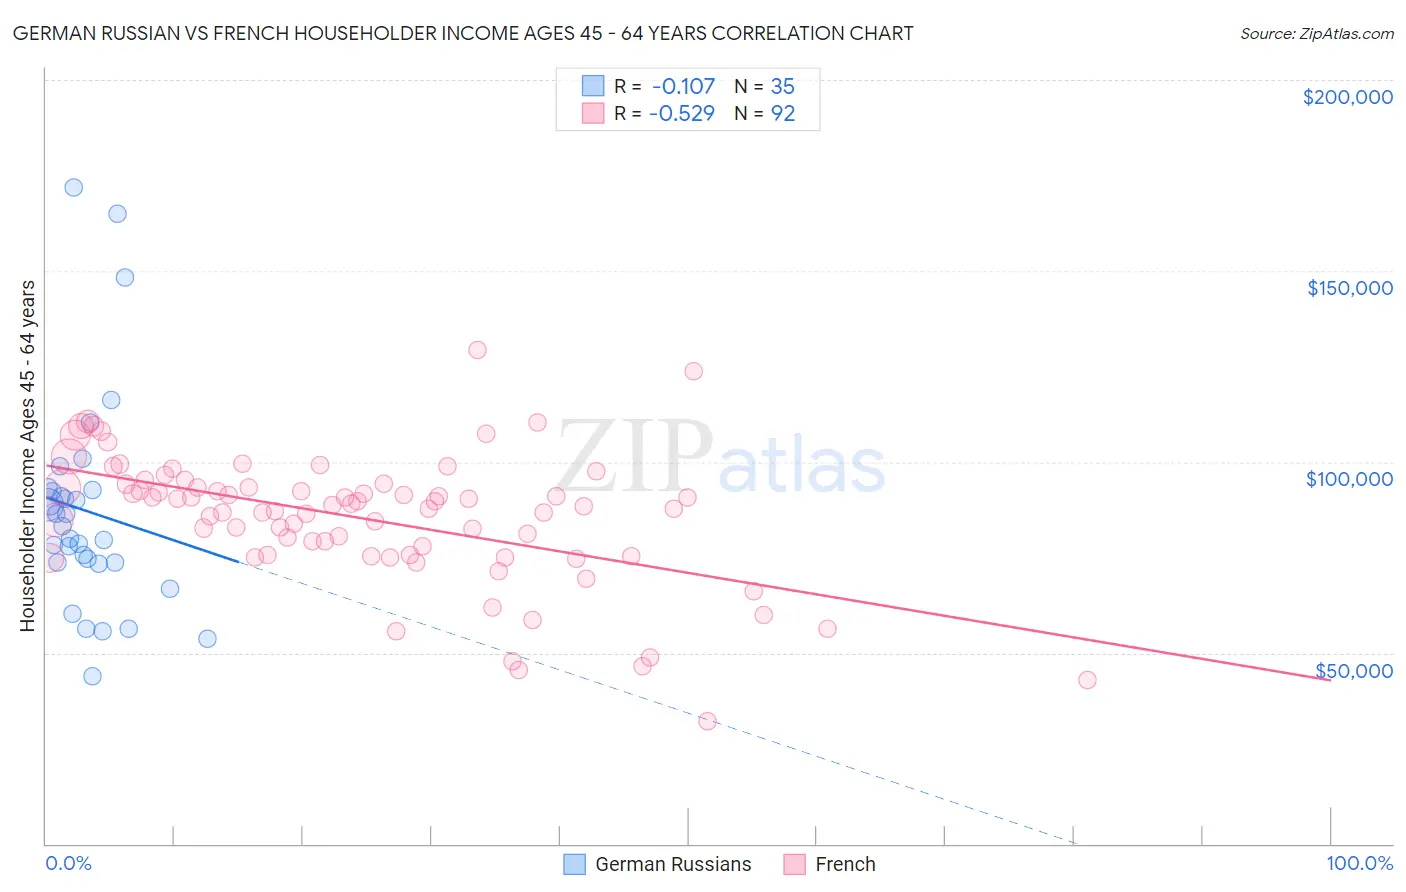
German Russian vs French Householder Income Ages 45 - 64 years Correlation Chart
The statistical analysis conducted on geographies consisting of 96,410,243 people shows a poor negative correlation between the proportion of German Russians and household income with householder between the ages 45 and 64 in the United States with a correlation coefficient (R) of -0.107 and weighted average of $89,398. Similarly, the statistical analysis conducted on geographies consisting of 568,632,779 people shows a substantial negative correlation between the proportion of French and household income with householder between the ages 45 and 64 in the United States with a correlation coefficient (R) of -0.529 and weighted average of $99,824, a difference of 11.7%.
Householder Income Ages 45 - 64 years Correlation Summary
| Measurement | German Russian | French |
| Minimum | $43,750 | $32,031 |
| Maximum | $171,788 | $129,396 |
| Range | $128,038 | $97,365 |
| Mean | $87,182 | $85,264 |
| Median | $83,043 | $88,490 |
| Interquartile 25% (IQ1) | $73,744 | $75,583 |
| Interquartile 75% (IQ3) | $92,651 | $93,777 |
| Interquartile Range (IQR) | $18,907 | $18,194 |
| Standard Deviation (Sample) | $28,210 | $17,163 |
| Standard Deviation (Population) | $27,804 | $17,070 |
Similar Demographics by Householder Income Ages 45 - 64 years
Demographics Similar to German Russians by Householder Income Ages 45 - 64 years
In terms of householder income ages 45 - 64 years, the demographic groups most similar to German Russians are Immigrants from Barbados ($89,394, a difference of 0.0%), Immigrants from Nicaragua ($89,108, a difference of 0.33%), French American Indian ($89,811, a difference of 0.46%), Liberian ($88,929, a difference of 0.53%), and West Indian ($89,906, a difference of 0.57%).
| Demographics | Rating | Rank | Householder Income Ages 45 - 64 years |
| Sub-Saharan Africans | 0.8 /100 | #250 | Tragic $90,691 |
| Americans | 0.7 /100 | #251 | Tragic $90,536 |
| Marshallese | 0.7 /100 | #252 | Tragic $90,455 |
| Barbadians | 0.6 /100 | #253 | Tragic $90,266 |
| Immigrants | Guyana | 0.6 /100 | #254 | Tragic $90,186 |
| West Indians | 0.5 /100 | #255 | Tragic $89,906 |
| French American Indians | 0.5 /100 | #256 | Tragic $89,811 |
| German Russians | 0.4 /100 | #257 | Tragic $89,398 |
| Immigrants | Barbados | 0.4 /100 | #258 | Tragic $89,394 |
| Immigrants | Nicaragua | 0.4 /100 | #259 | Tragic $89,108 |
| Liberians | 0.3 /100 | #260 | Tragic $88,929 |
| Belizeans | 0.3 /100 | #261 | Tragic $88,684 |
| Somalis | 0.3 /100 | #262 | Tragic $88,600 |
| Immigrants | Senegal | 0.3 /100 | #263 | Tragic $88,421 |
| Osage | 0.3 /100 | #264 | Tragic $88,390 |
Demographics Similar to French by Householder Income Ages 45 - 64 years
In terms of householder income ages 45 - 64 years, the demographic groups most similar to French are Colombian ($99,772, a difference of 0.050%), Spaniard ($99,889, a difference of 0.070%), Finnish ($99,904, a difference of 0.080%), Immigrants ($99,943, a difference of 0.12%), and Dutch ($99,650, a difference of 0.17%).
| Demographics | Rating | Rank | Householder Income Ages 45 - 64 years |
| Moroccans | 47.7 /100 | #177 | Average $100,138 |
| Immigrants | Cameroon | 47.0 /100 | #178 | Average $100,084 |
| Belgians | 46.7 /100 | #179 | Average $100,060 |
| Aleuts | 46.6 /100 | #180 | Average $100,052 |
| Immigrants | Immigrants | 45.3 /100 | #181 | Average $99,943 |
| Finns | 44.8 /100 | #182 | Average $99,904 |
| Spaniards | 44.6 /100 | #183 | Average $99,889 |
| French | 43.8 /100 | #184 | Average $99,824 |
| Colombians | 43.2 /100 | #185 | Average $99,772 |
| Dutch | 41.7 /100 | #186 | Average $99,650 |
| Iraqis | 38.5 /100 | #187 | Fair $99,387 |
| Immigrants | Portugal | 36.3 /100 | #188 | Fair $99,203 |
| Immigrants | South America | 35.4 /100 | #189 | Fair $99,126 |
| French Canadians | 35.1 /100 | #190 | Fair $99,093 |
| Kenyans | 33.7 /100 | #191 | Fair $98,970 |